Manage KPIs
Apromore allows us to create and manage KPIs on an event log, which can be used to track SLA breaches in a process. To create a KPI in Apromore, go to Portal. Select the event log for which we’d like to create the KPI. Right-click and select KPIs.

Existing KPIs created for the event log appear. If no KPI has been added to the log, the KPI window appears empty. To add a new KPI, click Add new.
We can either create a KPI or a metric. Click KPI.
This opens the New KPI, where we define the KPI information.
We can also create a KPI from the KPIs & Metrics center. From Portal, click KPIs & Metrics.

Existing KPIs and metrics will appear.

To create a new KPI, click Add new > KPI.
Select the log for which we wish to create the KPI and click Select log.
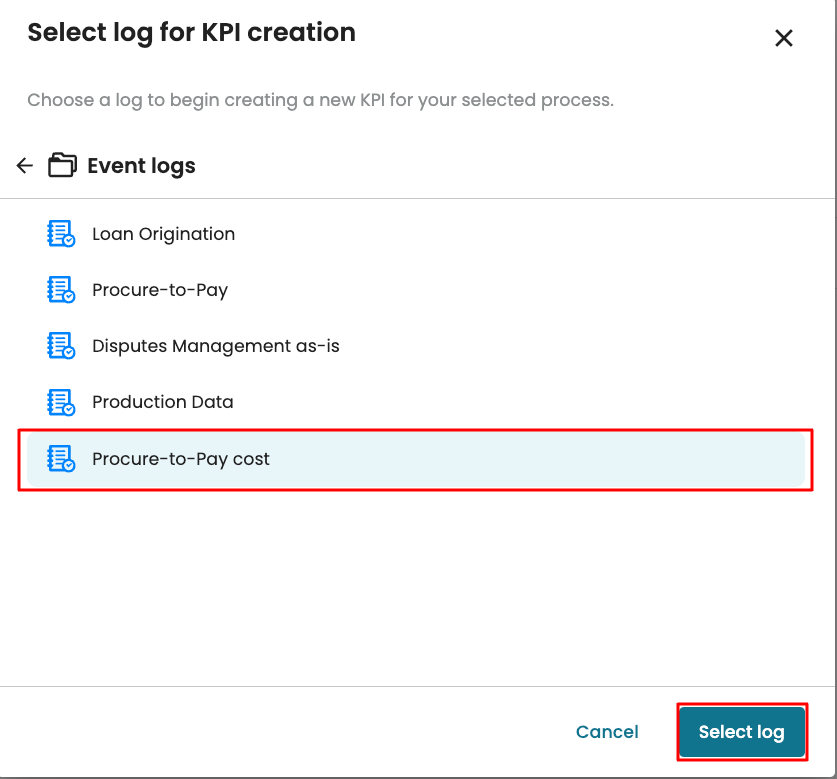
Again, this opens the New KPI window.
For a KPI to be successfully created, we need to define the KPI name, KPI population, KPI condition, and KPI target. We can optionally add a description to the KPI.
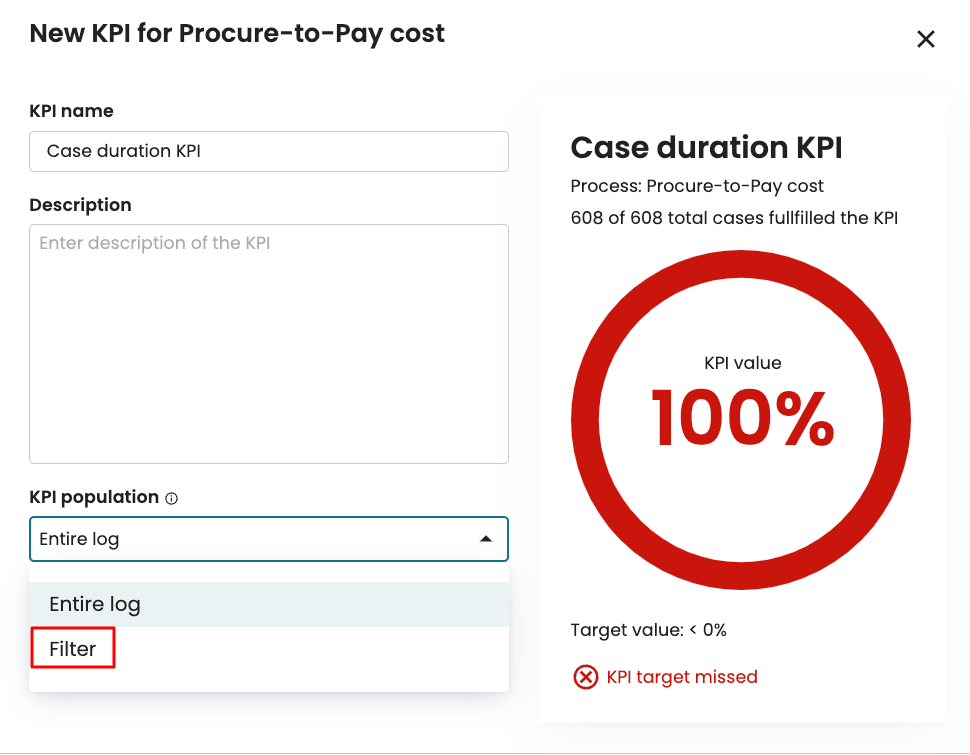
Enter a KPI name. This name will be used for future reference in the KPI. We can call it Case duration KPI. We can optionally enter a description.
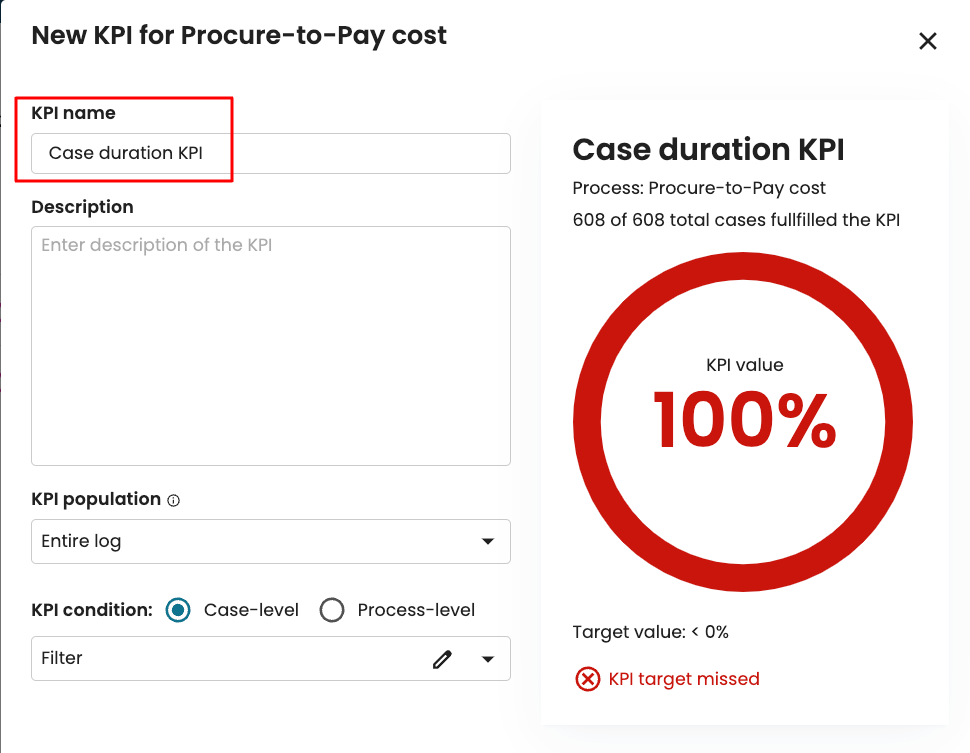
Specify the KPI population
The KPI population defines the subset of logs to which the KPI condition will apply. By default, the KPI population is set to Entire log. This means that the KPI condition will apply to the entire log.
We can, however, apply the KPI condition on a subset of the log. For example, if we wish to track only high-cost cases, we can set the KPI to apply to a subset of the log where the case cost is more than 50 EUR. To do that, click on the dropdown next to KPI population. Select Filter.
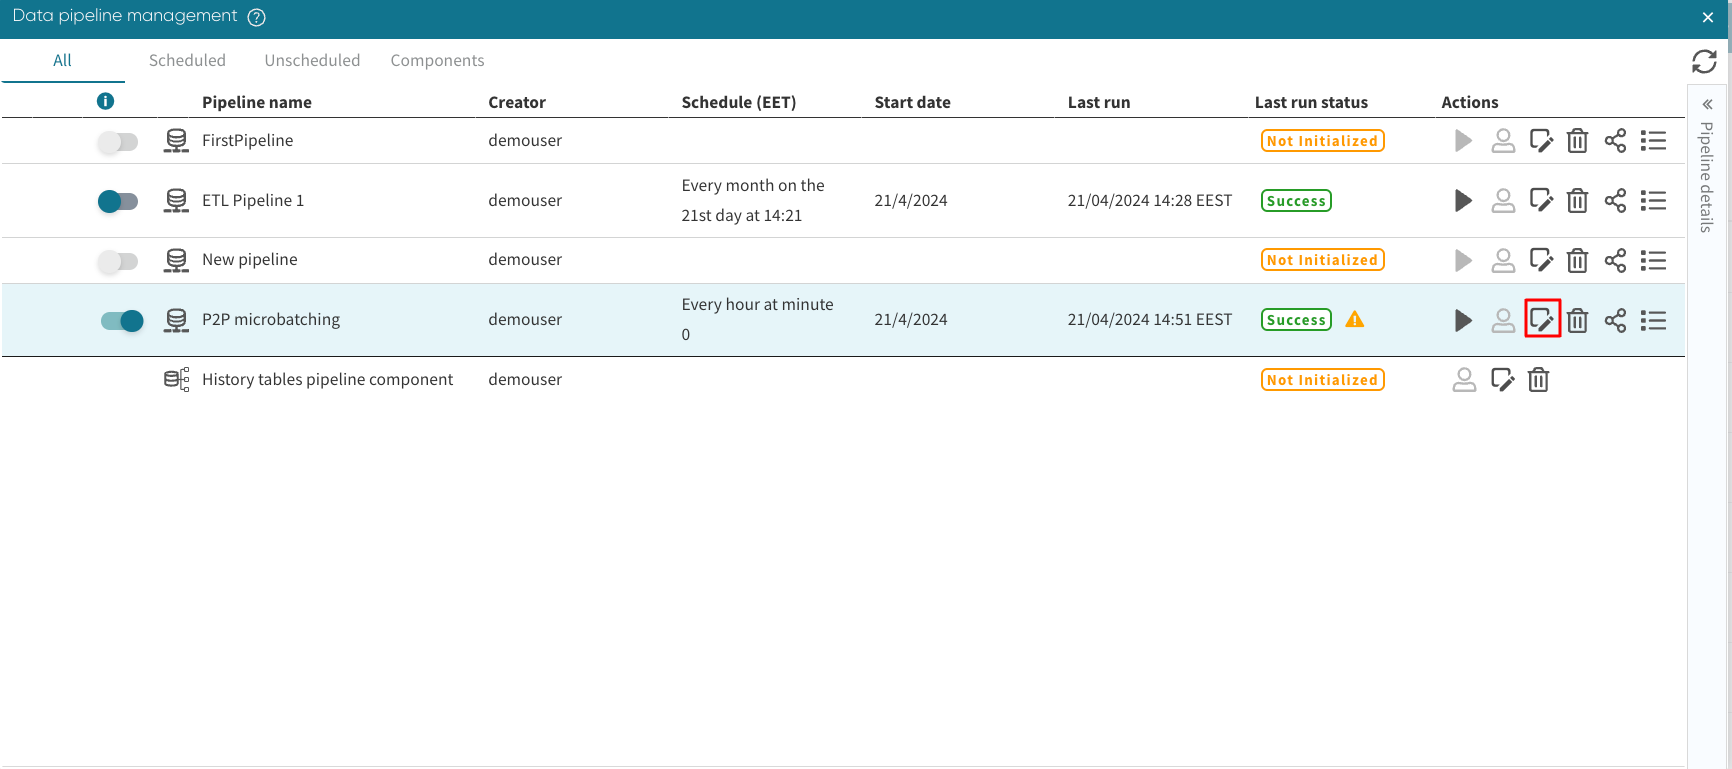
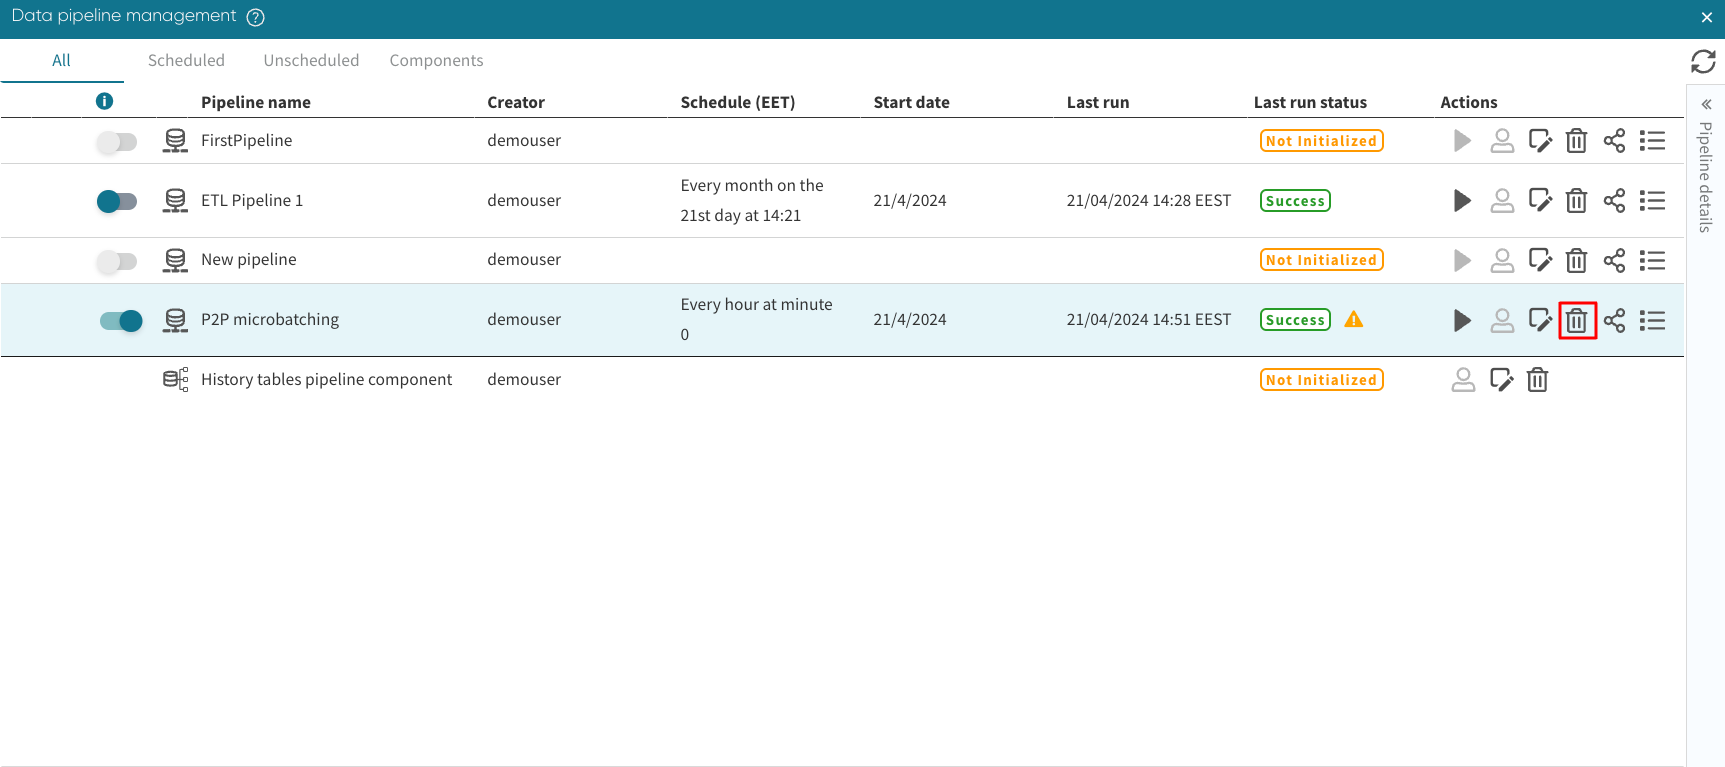
Click the Edit icon to add the filter.

The Filter log window appears. To create the filter, go to the case Performance tab. In the Performance measure dropdown, select Case cost.
We can use the slider to select cases whose cost is greater than 50 EUR. Click OK.
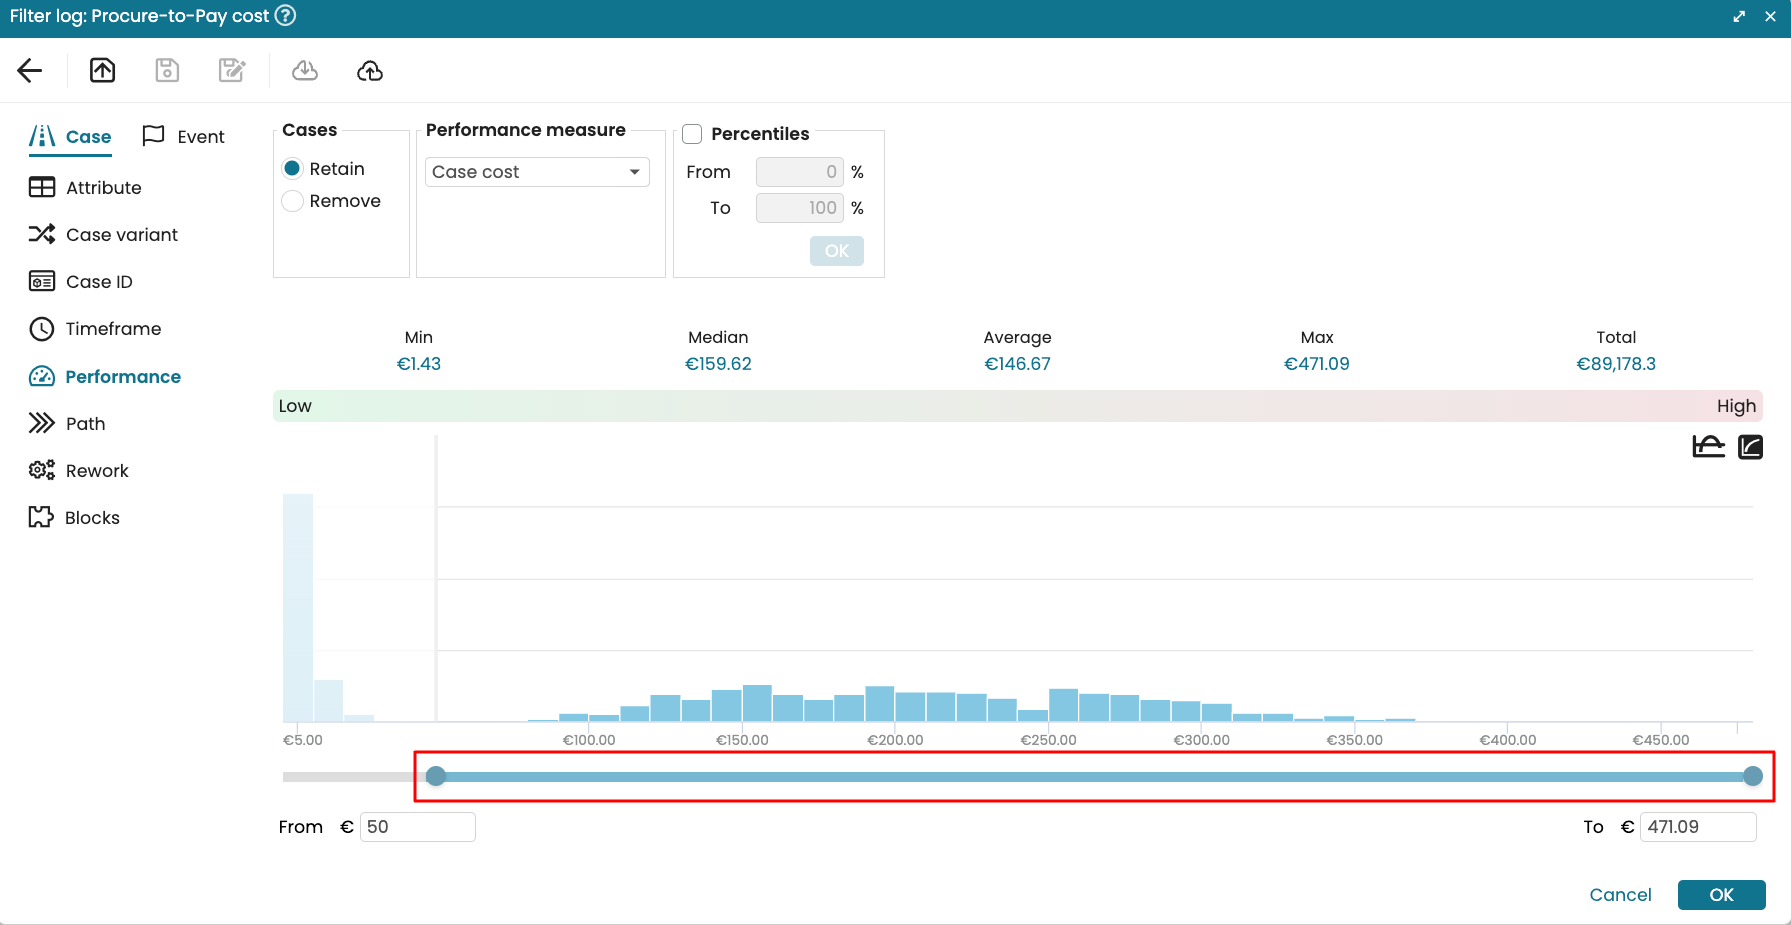
The filter is applied as the KPI population. Notice that the total number of cases is not 411 from 608.
Specify the KPI condition
The KPI condition is the SLA violation we wish to track. We can create this condition either on the case level or the process level. Case-level KPIs are defined using filters, while process-level KPIs are defined using custom metrics.
Case-level KPIs
Case-level KPIs are KPIs created through filters. The KPI result is the number or the percentage of cases that meet the filter criteria. To specify the KPI condition, click the KPI condition dropdown.
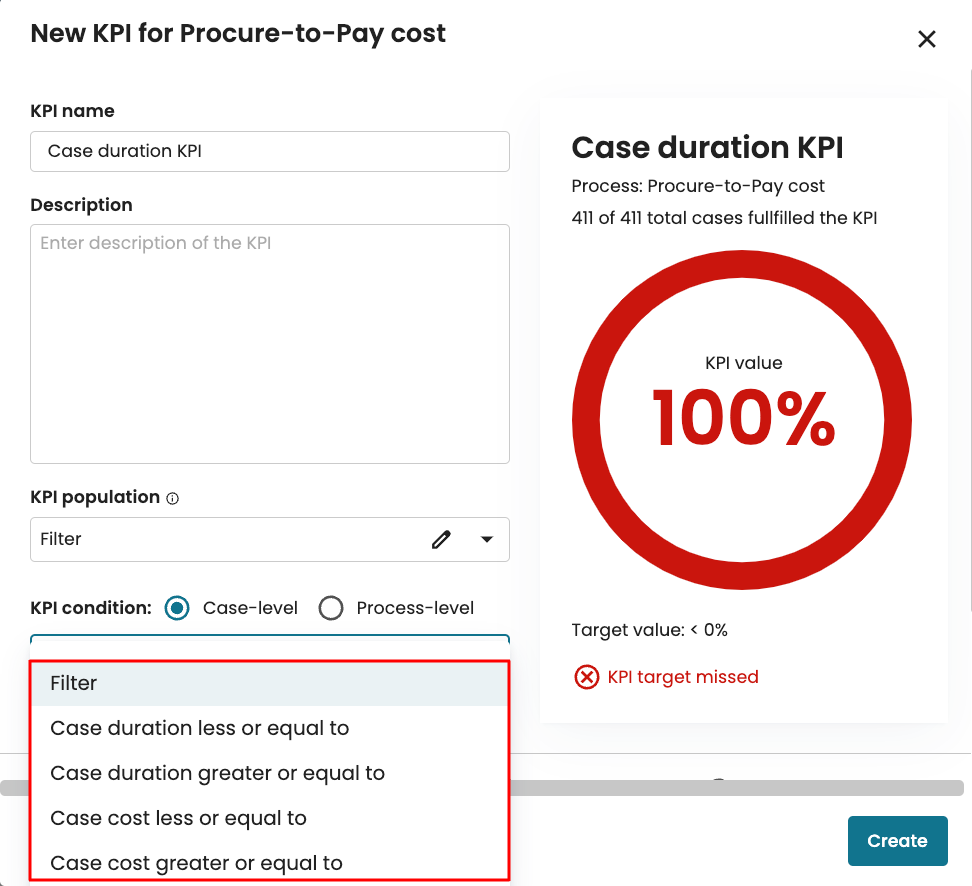
If the KPI involves case duration or case cost, we can simply select the appropriate option. For instance, if our KPI is that cases should be less than 90 days, we
choose Case duration is less than or equal to. Enter 90 as the value, and click Days from the dropdown.
383 of 411 cases, or 93.19% of the cases, take within 90 days. We can, more generally, specify the condition using filters. To create a KPI condition with filters, click Filter from the dropdown.

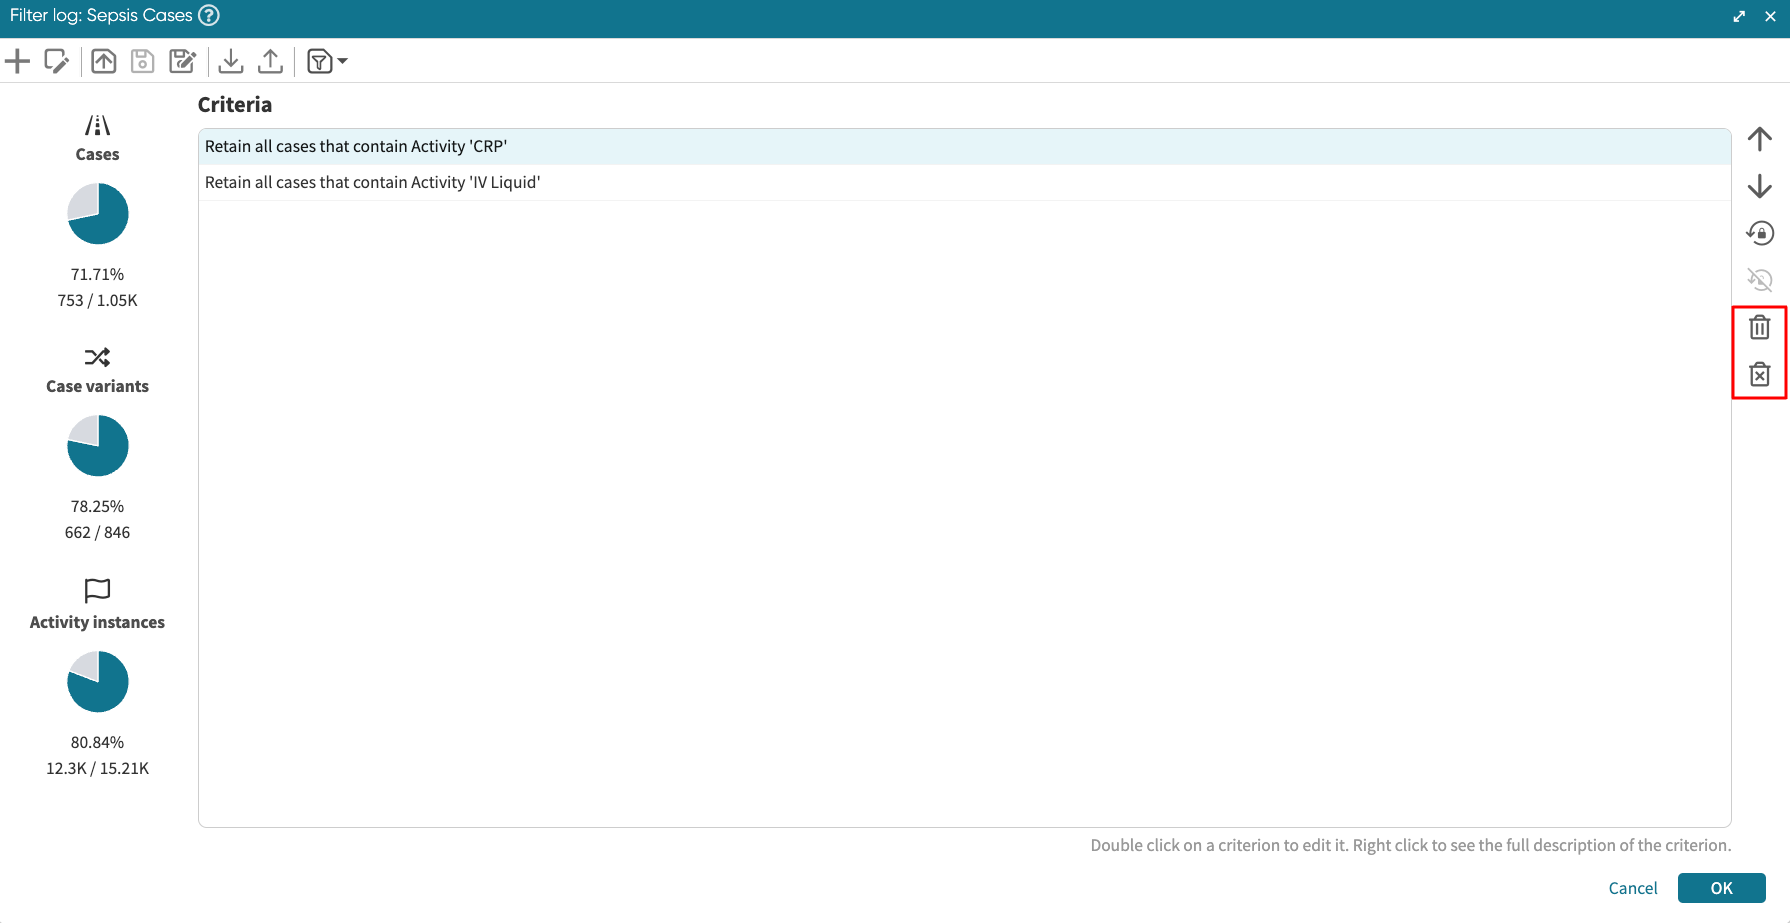
With filters, we can create a more complex KPI condition. Let’s create a KPI condition where the case duration is within 12 weeks. We create a filter that satisfies this KPI condition. To create a filter, click the Edit icon.
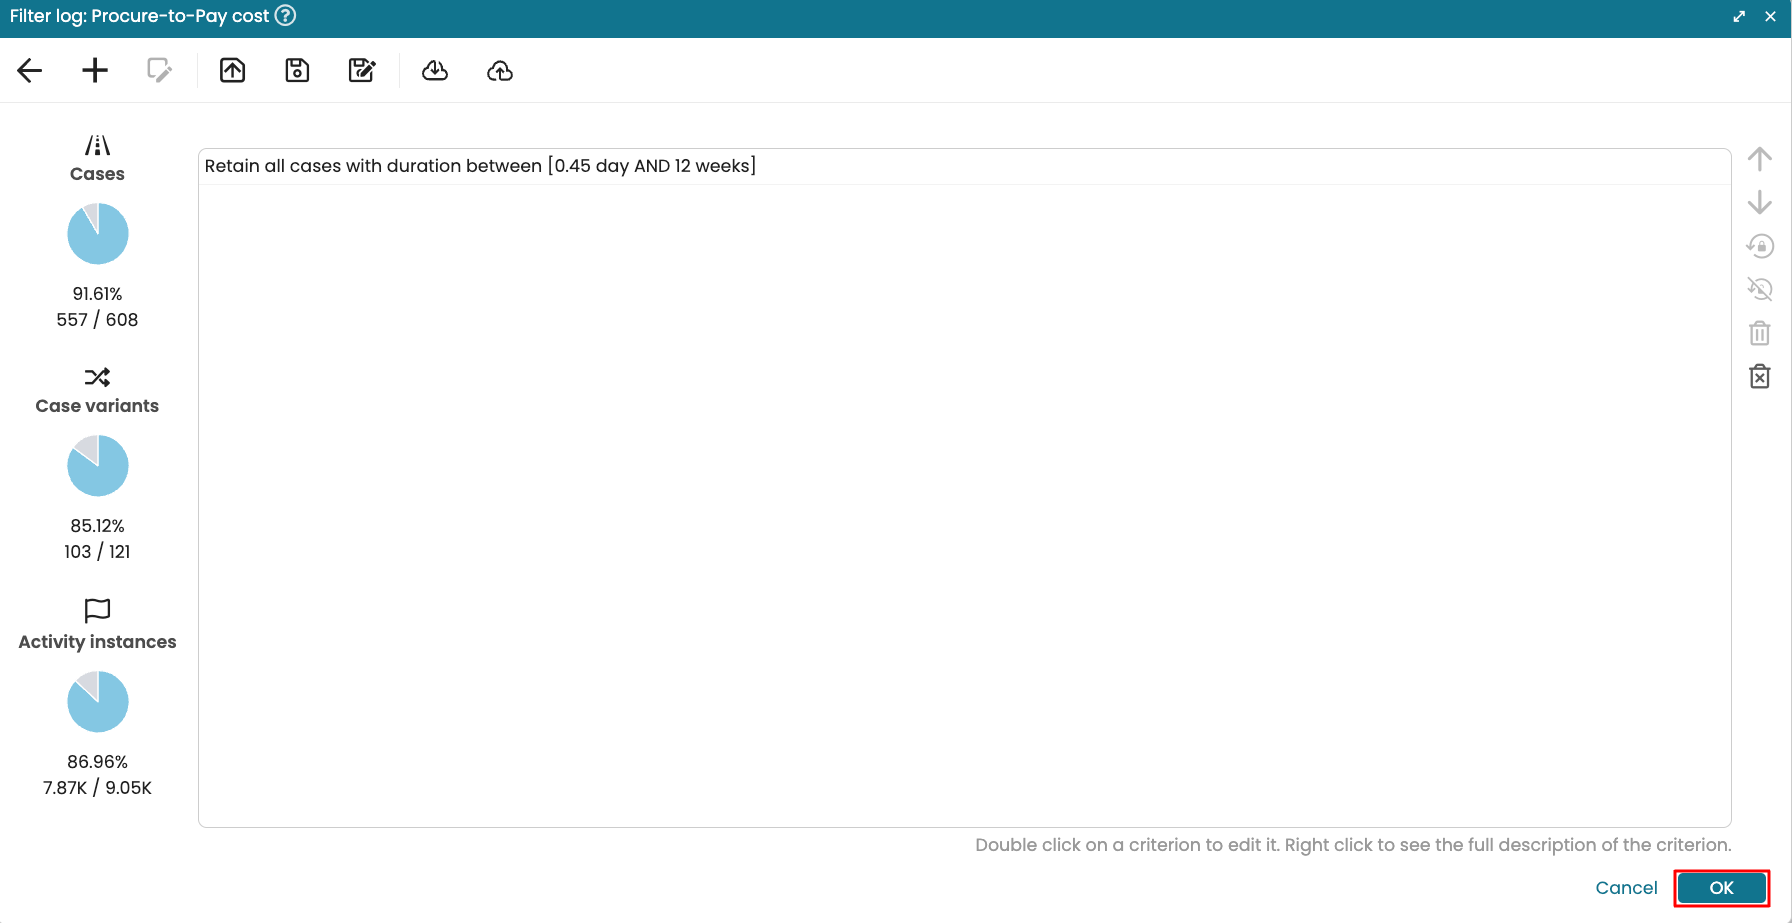
The Filter log window pops up. To create the filter, go to the case Performance tab. From the performance measure dropdown, select Case duration. Use the slider to select the average processing time range. Click OK.
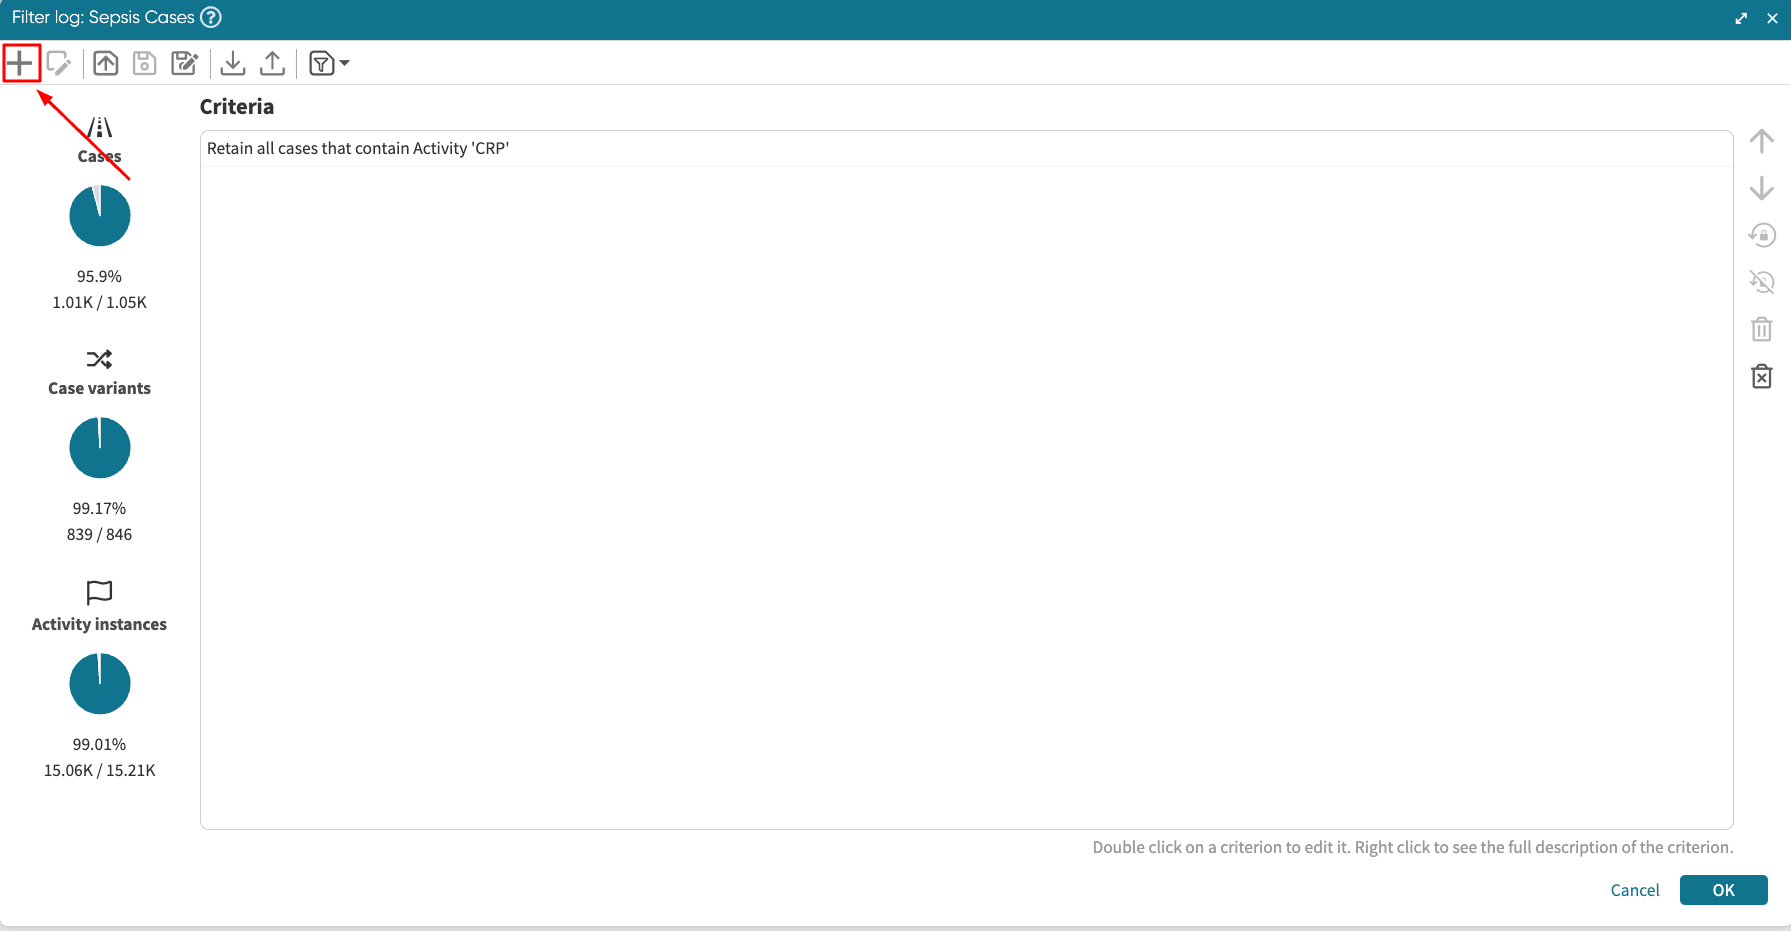
If we wish to create another filter, click the “+” button in the top left corner and specify the new one.
Once we have created the filter(s) that satisfies the KPI, click OK.
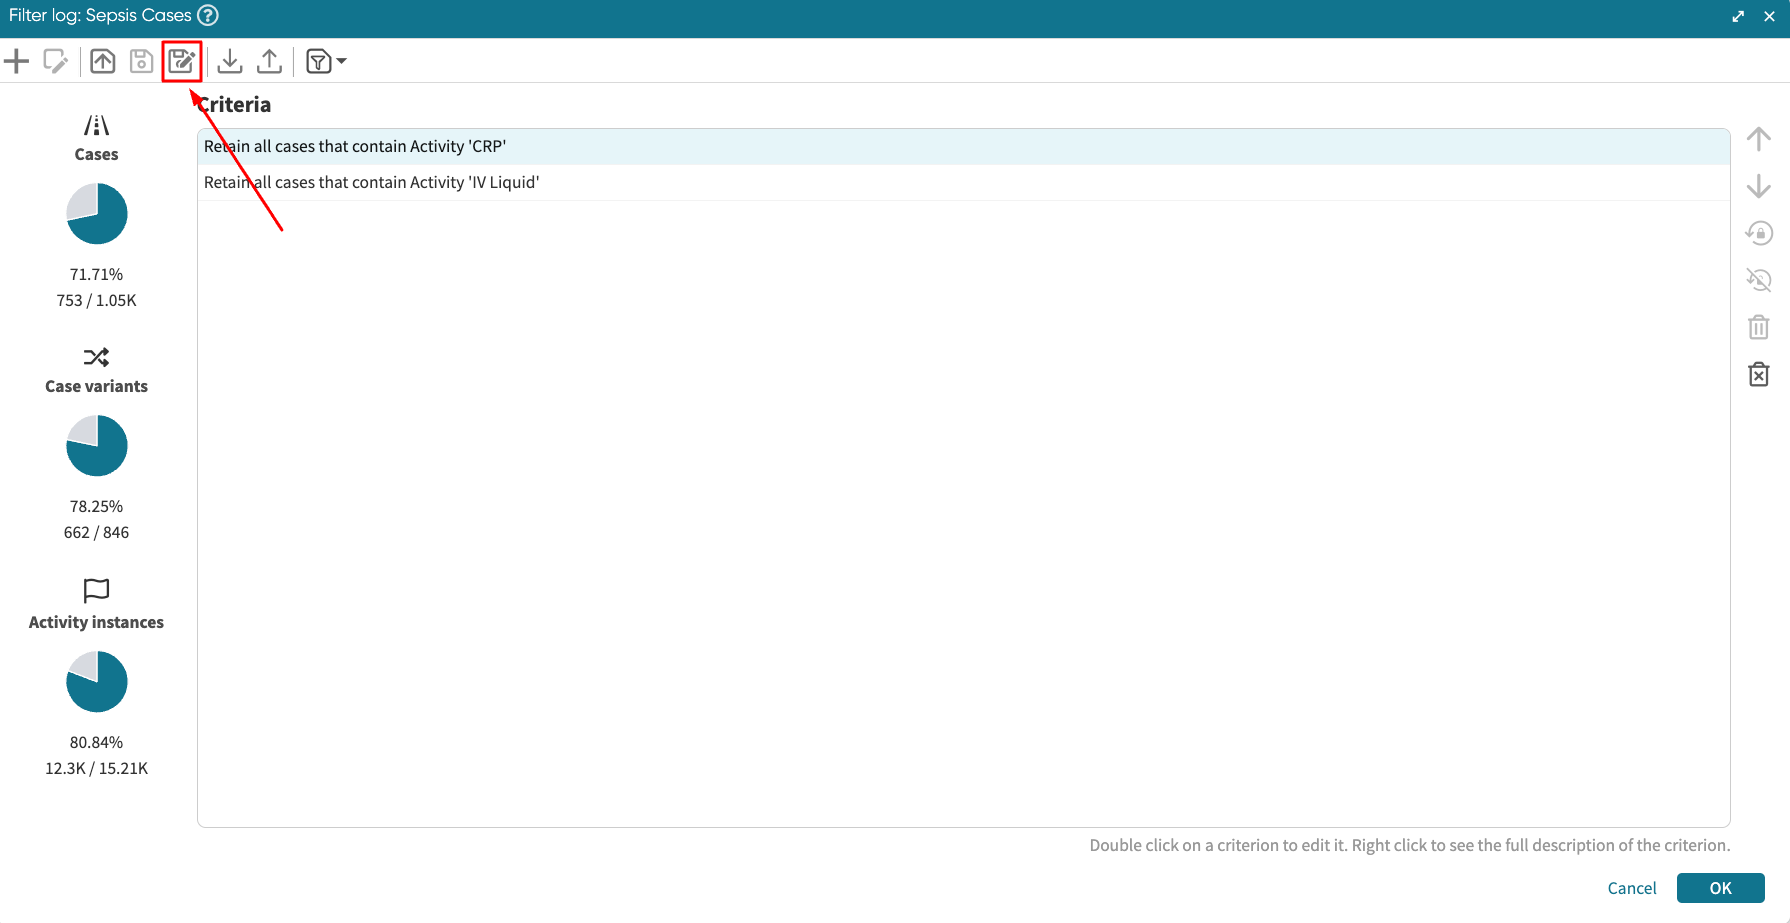
The filter(s) will be applied as the KPI condition. We can edit the filter by clicking the Edit icon again.
Process-level KPIs
Case-level KPIs track the process performance based on the number of cases that fulfill a condition. For instance, in a claims management process, we could create a case-level KPI that checks the number of claims that were completed is under three weeks. Case-level KPIs such as these focus on individual cases rather than the process as a whole. If, on the other hand, we want to create a KPI that checks the average processing time of the process, case-level KPIs fall short. Process-level KPIs can, however, achieve this.
Process-level KPIs allow us to create KPIs based on the performance of the entire process. We can then identify when the process falls below a set target, ensuring we quickly detect inefficiencies. Process-level KPIs are created from custom metrics. To learn about creating custom metrics, see Manage metrics.
Imagine, in a claims management process, we have created a custom metric called “Claims per resource”. This metric calculates the number of claims done by a resource on average in the process. We can then create a process-level KPI that checks whether the metric is above or below a threshold. Let us say when the “Claims per resource” metric is greater than 25, the KPI should be violated. To create this KPI, create a new KPI on the claims management log. Specify the name and a description.

In KPI population, select Entire log.
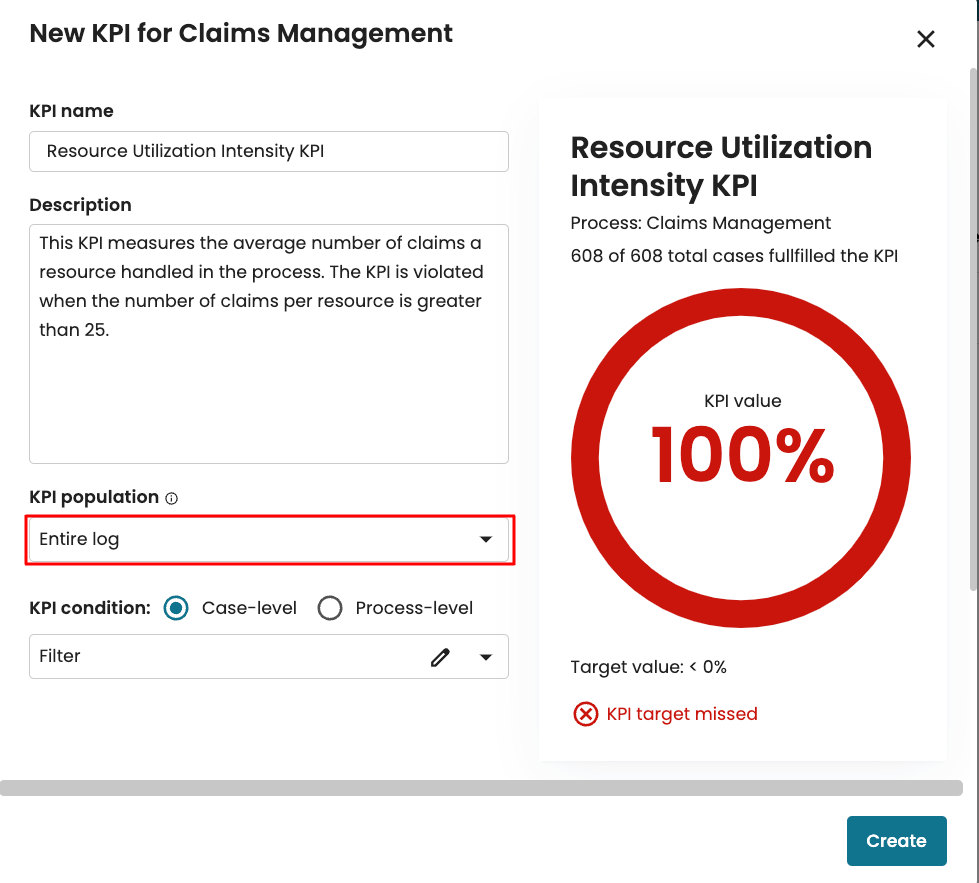
In KPI condition, select Process-level.

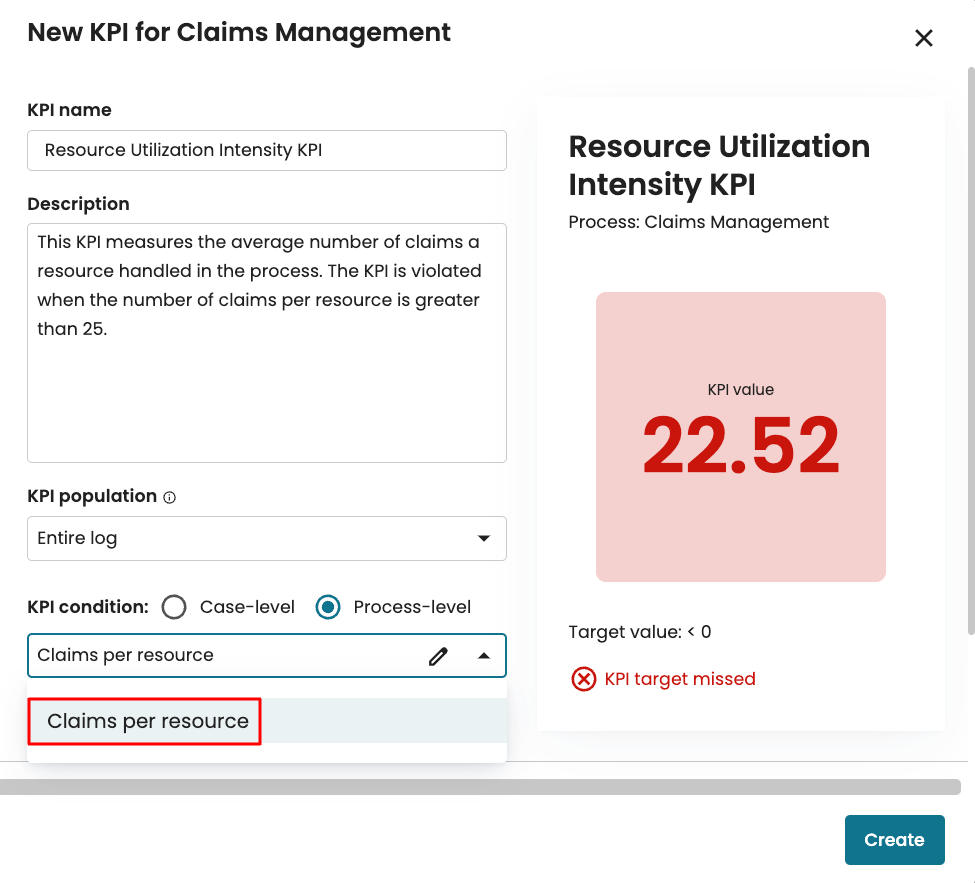
Any existing metric on the log will appear in the dropdown. Select the metric to be used. In our case, we select the already created “Claims per resource” metric.
If we want to create a new metric for the KPI, click Add Metric.
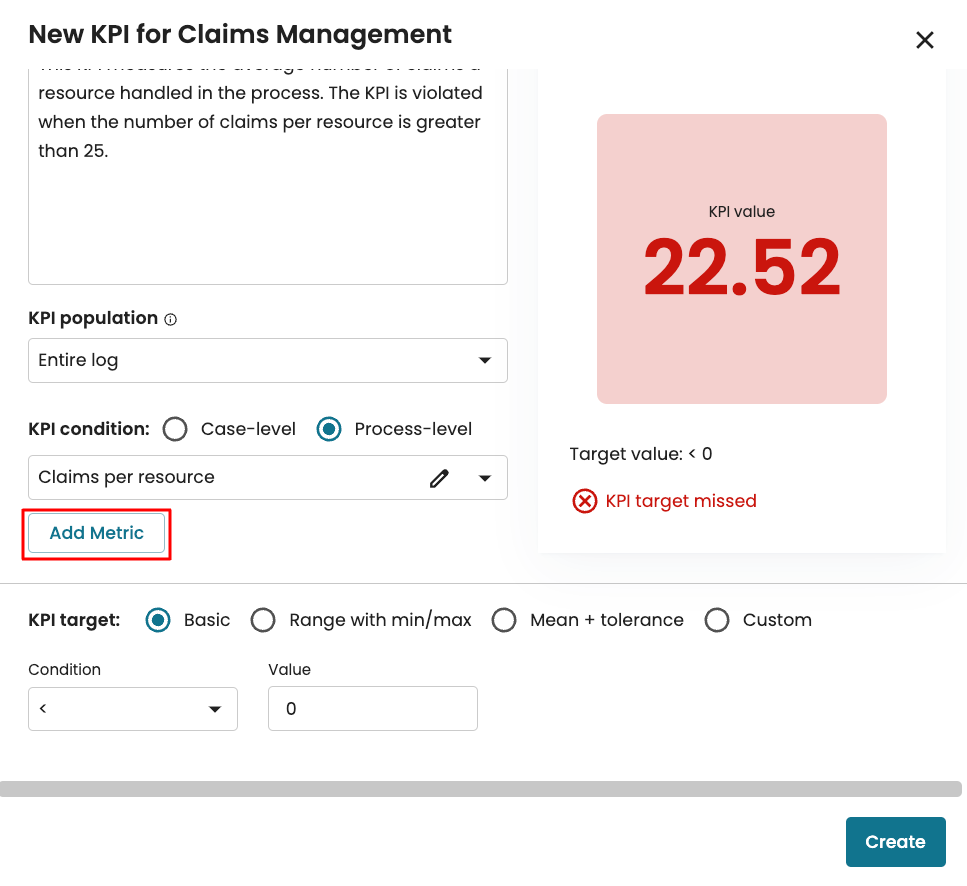
This allows us to create a new metric on the log that can be used to create the KPI. Finally, specify the KPI target. In our case, we want the metric to always be less than 25.
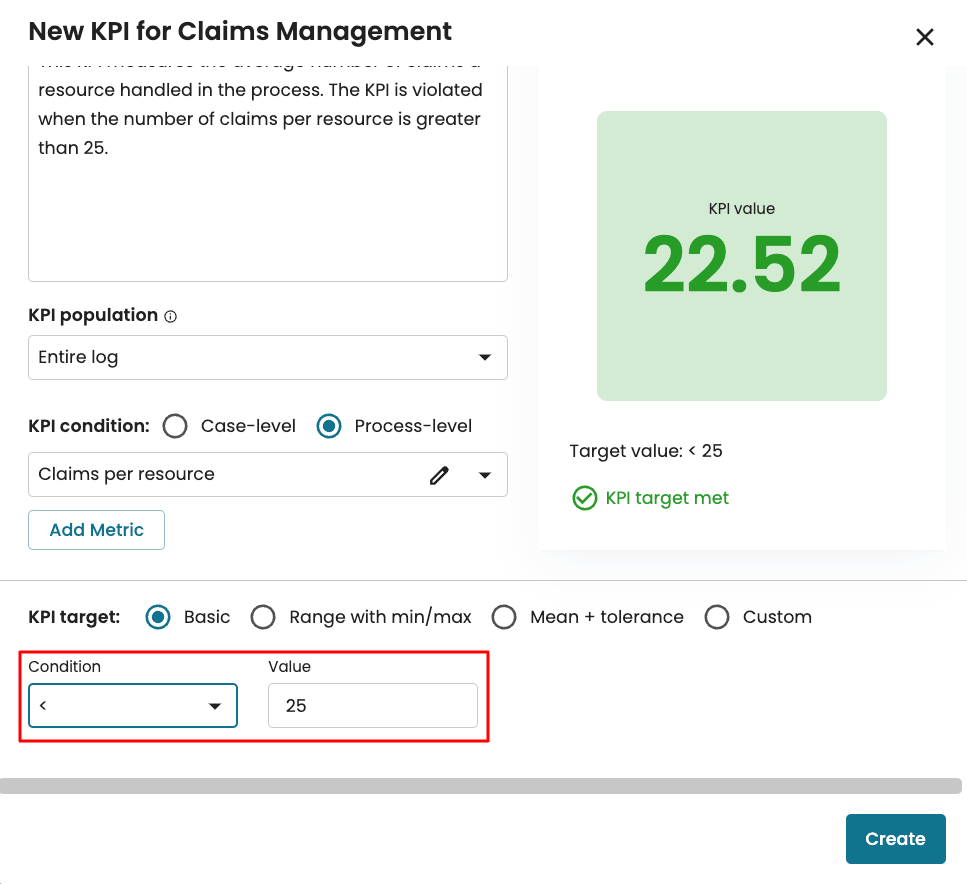
Because the KPI value (22.52) is less than the target (25), the KPI would be fulfilled. Click Create to save the KPI.
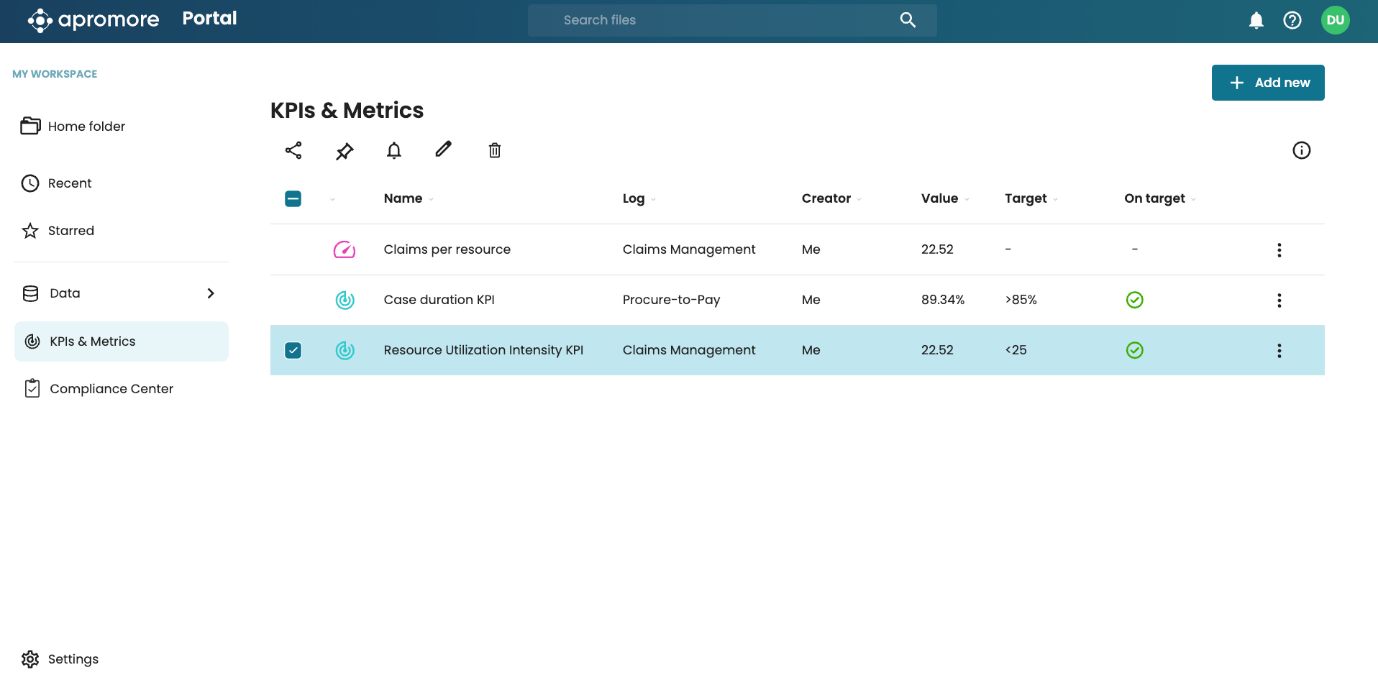
The KPI now appears in KPIs & Metrics, where we can track its fulfillment or violation as the process evolves.
Specify the KPI target
The KPI target defines the permissible threshold for which the KPI will be triggered. We can specify the KPI target using the basic or advanced settings.
Define a basic KPI target
By default, the KPI target is set to Basic. In Basic, we can only set a target (also called a threshold) to trigger the KPI. When the threshold is exceeded, the KPI is triggered with the colour red, indicating an SLA violation exists. When the threshold is not exceeded, the KPI is triggered with the colour green, indicating no SLA violations.
For example, we may want the KPI to appear green when the percentage of cases that fulfill the KPI condition is equal to 100. Otherwise, appears red.
To do this, ensure Show as percentage is checked.
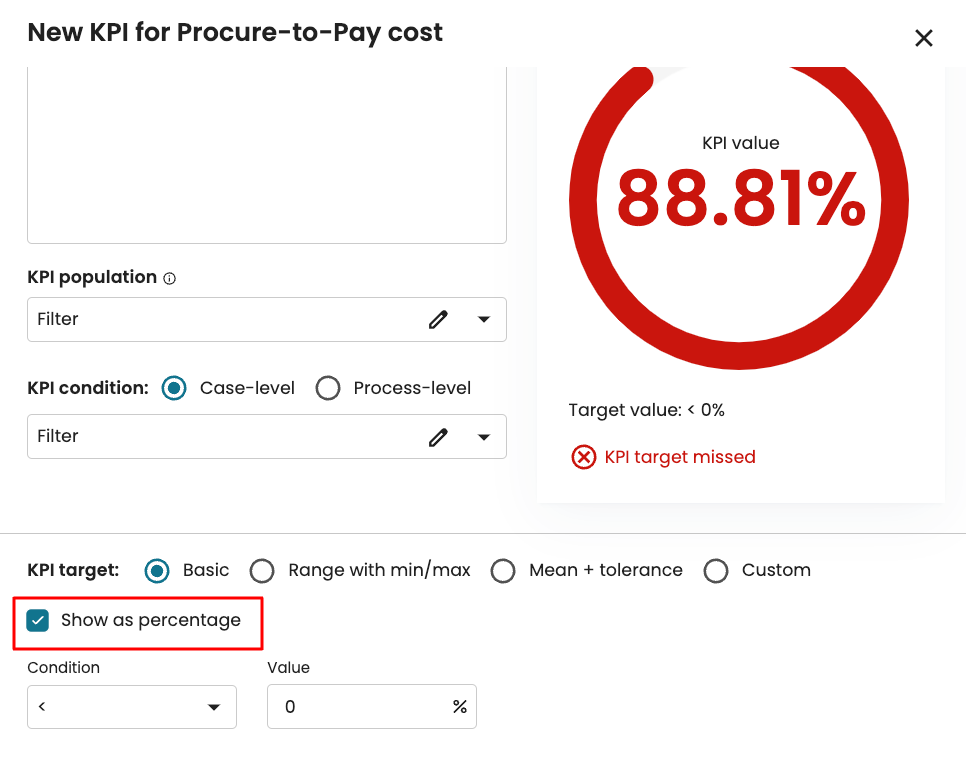
When this is not checked, values are considered as numbers, not percentages.
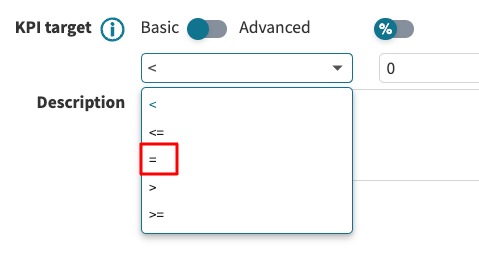
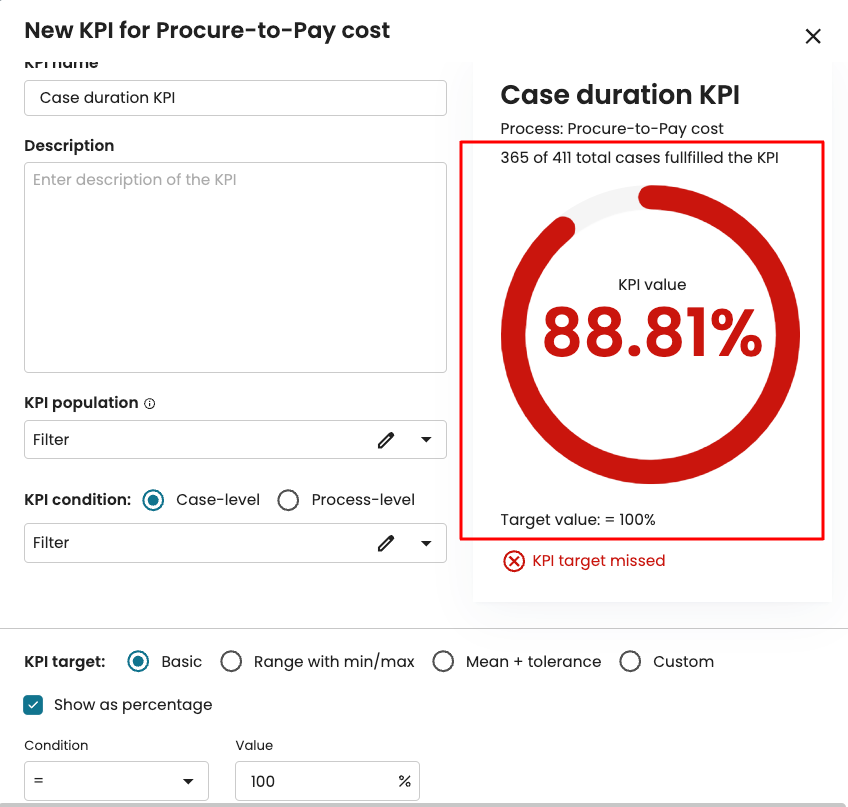
In the dropdown, we may select less than (<), less than or equal to (<=), equal to (=), greater than (>), or greater than or equal to (>=). In our case, we select equal to. In the text box, enter the value. In our example, we want the KPI to be fulfilled when all the cases satisfy the KPI condition. We enter 100.
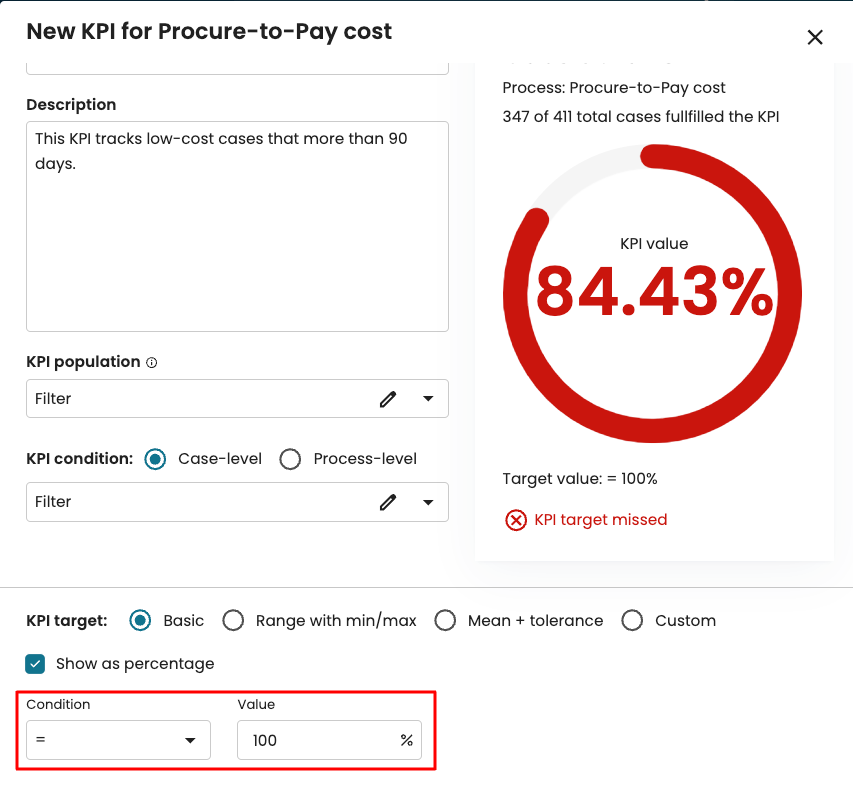
The KPI appears red because the percentage of cases that satisfy the KPI is 88.81%. The set target of 100% is not met.
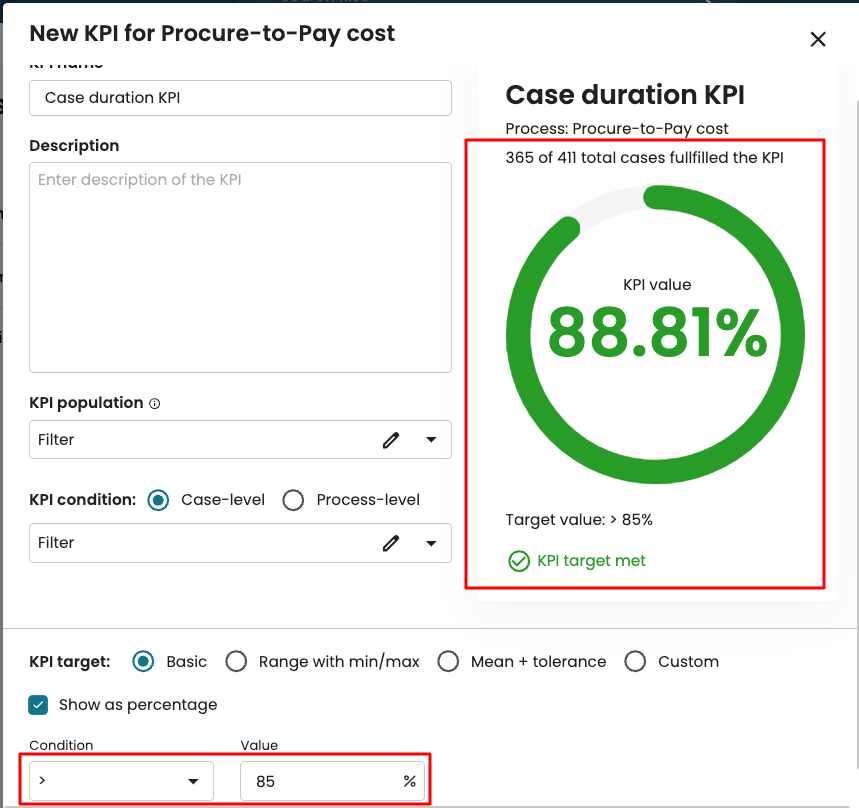
It is, however, customary to have a target within a permission threshold. If we change the threshold to any value greater than 85%, the KPI will be triggered with green. This is because the KPI result, 88.81%, exceeds the threshold we have set (> 85%).
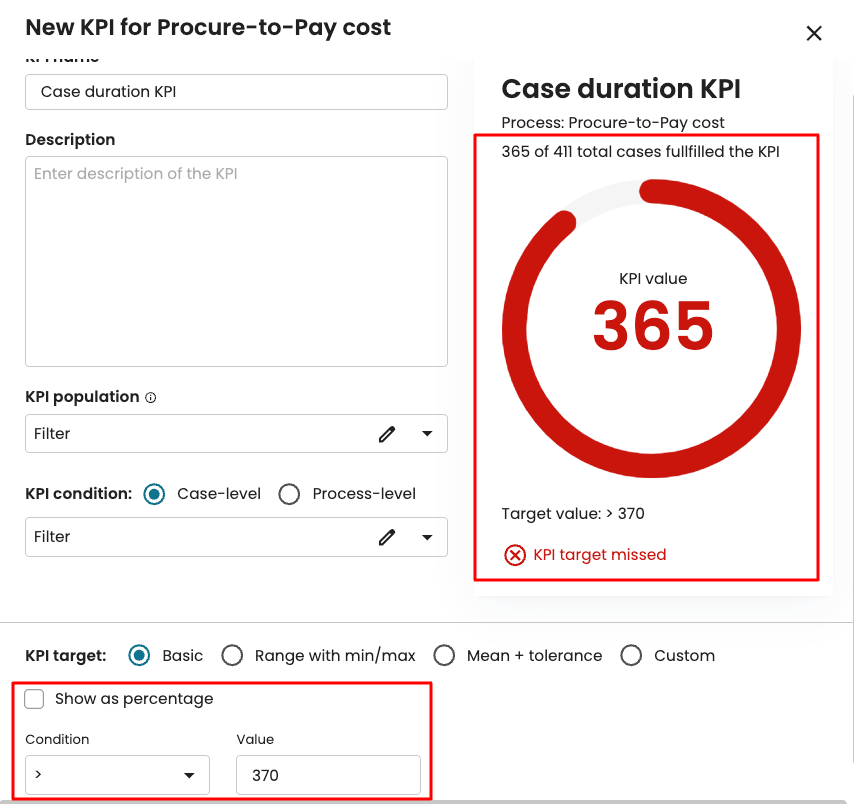
It may also set the threshold using numbers and not percentages. To do this, uncheck Show as percentage. The threshold is now defined based on the KPI value.
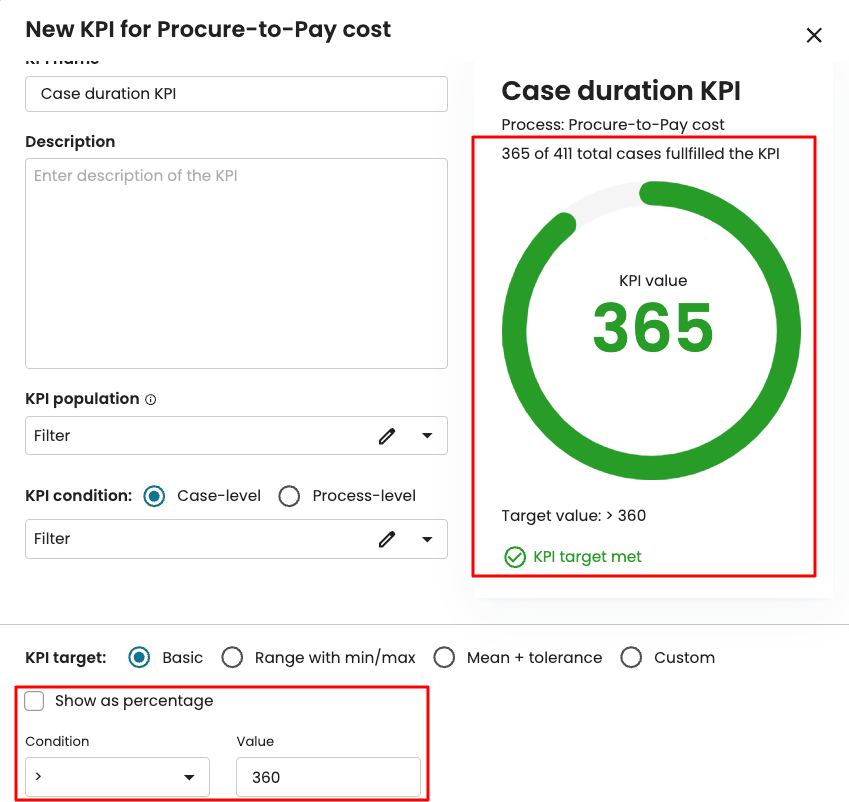
Here, we see the KPI is green because 365 of 411 cases fulfill the KPI condition, which is greater than our set target (> 360). If, for instance, we increase our target to 370 or greater, the KPI would be violated and turn red.
Tip
It may, however, be more convenient to set the Kpi target through percentages.
Define a target using a range
The Range with min/max option allows us to define the target using a range of lower and upper rather than a single value. For instance, we may say the KPI is fulfilled only if the percentage of cases that fulfill the KPI condition is between 80% and 100% (a range. Otherwise, it is violated. To do so, select Range with min/max and enter the upper and lower bound percentages.
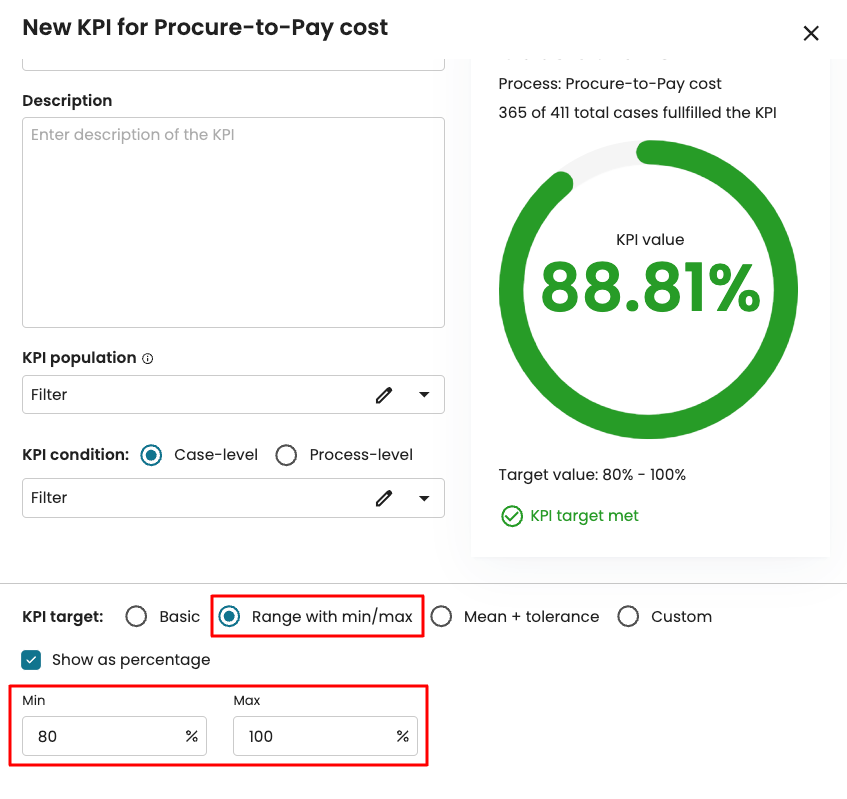
The KPI is green since the cases that fulfill the KPI condition (88.81%) are within the range (80 to 100%).
Define a target using mean + tolerance
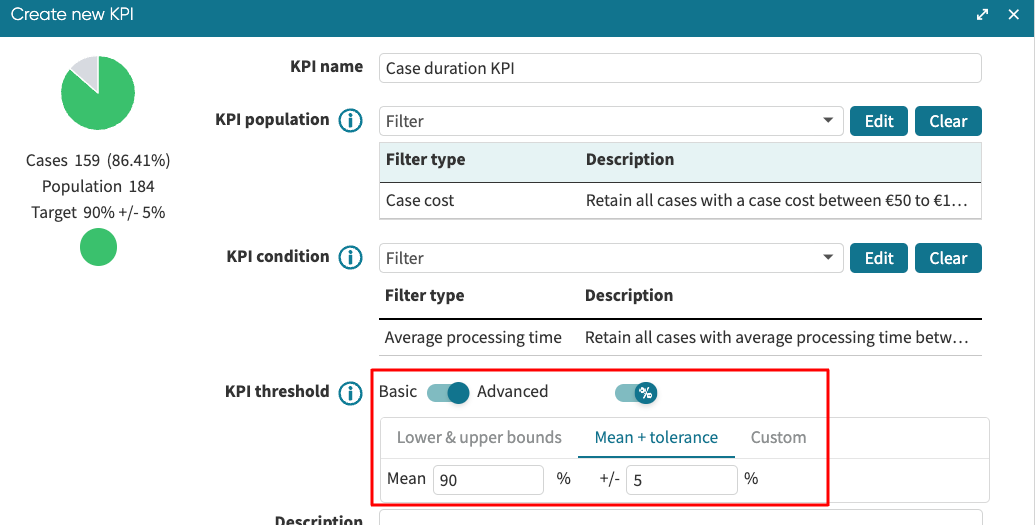
We may also define the KPI target using a mean value and some tolerance. For instance, we may set the threshold to 90% with a tolerance of 5%. This means the range will be 90% - (5% of 90) and 90% + (5% of 90). That is a range of 85.5% to 94.5%.
To implement this, select Mean + tolerance. Enter 90 as mean and 5 as tolerance.
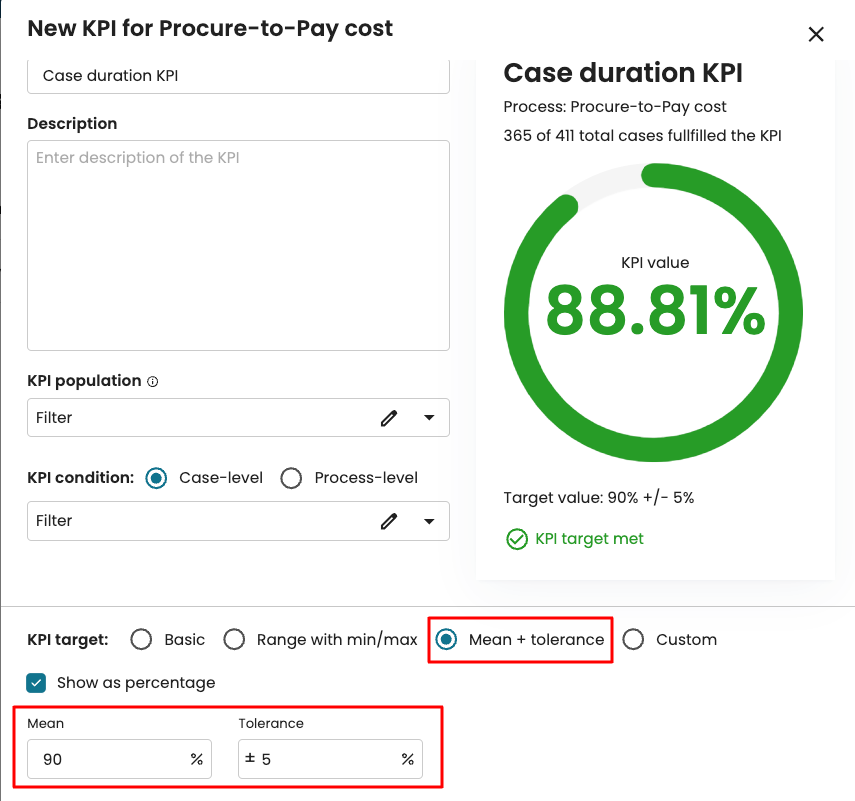
We see the KPI is green because 88.81% is greater than the lower bound of the tolerance (85.5%) and less than the upper bound of the tolerance (94.5%).
If we change the tolerance to 1%, the range becomes 89.1% to 90.9%.
Since 88.81% does not fall in this range, the KPI is violated with red.
Define a target using custom thresholds
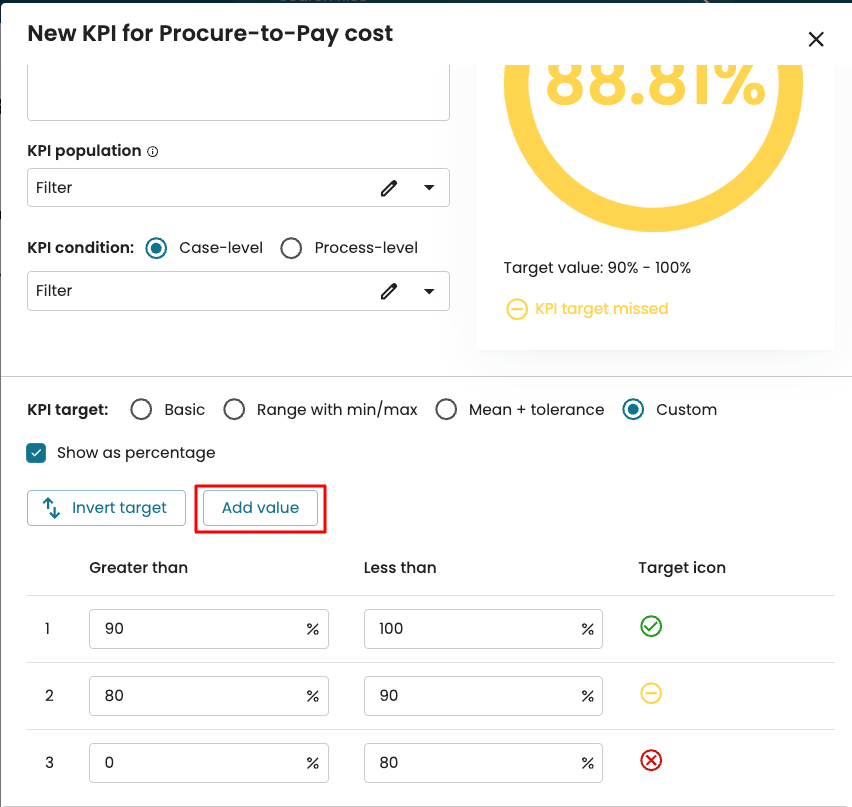
We can build a custom threshold that allows for more complexity to the upper and lower bounds and the associated target icon (color code). For instance, we may decide that the red color appears when the percentage is less than 80%. When it is between 80 to 90%, it is amber; when it is greater than 90%, it is green.
To do this, select Custom and enter the ranges.
We can add more range and colors if we desire by clicking Add value.
Note
We may delete a range and its associated color by clicking ×.

We can also invert the target icon for each range by clicking Invert target.

Click Create to save the KPI.
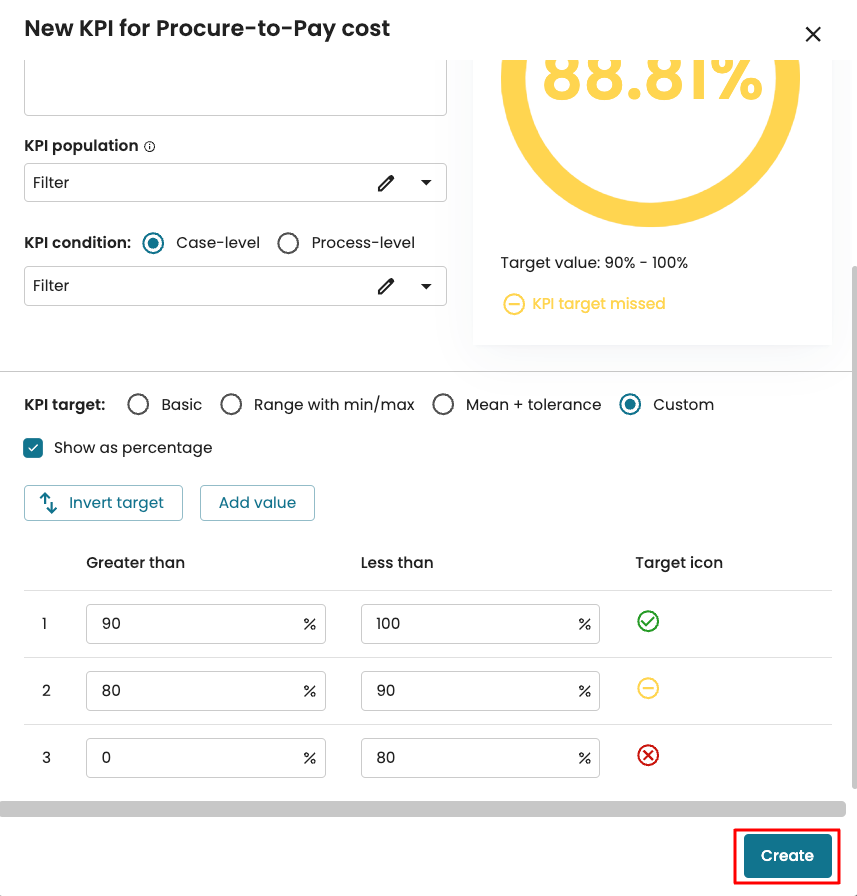
The KPI is saved and appears in the KPI & Metrics center.
Get KPI breach notifications
Receiving prompt notifications when a KPI is breached is essential for ensuring prompt responses to deviations. We can subscribe to notifications whenever a KPI is breached. A notification will be sent when:
The log upon which the KPI was created gets updated, causing a change in the KPI’s fulfillment or violation.
When the KPI is edited, resulting in a different KPI outcome.
To subscribe to KPI breach notifications, go to KPIs & Metrics and select the KPI.
Right-click and select click Notifications.
We can toggle on the specific notifications we want. Alternatively, we can click on the KPI and click the bell icon in the toolbar.

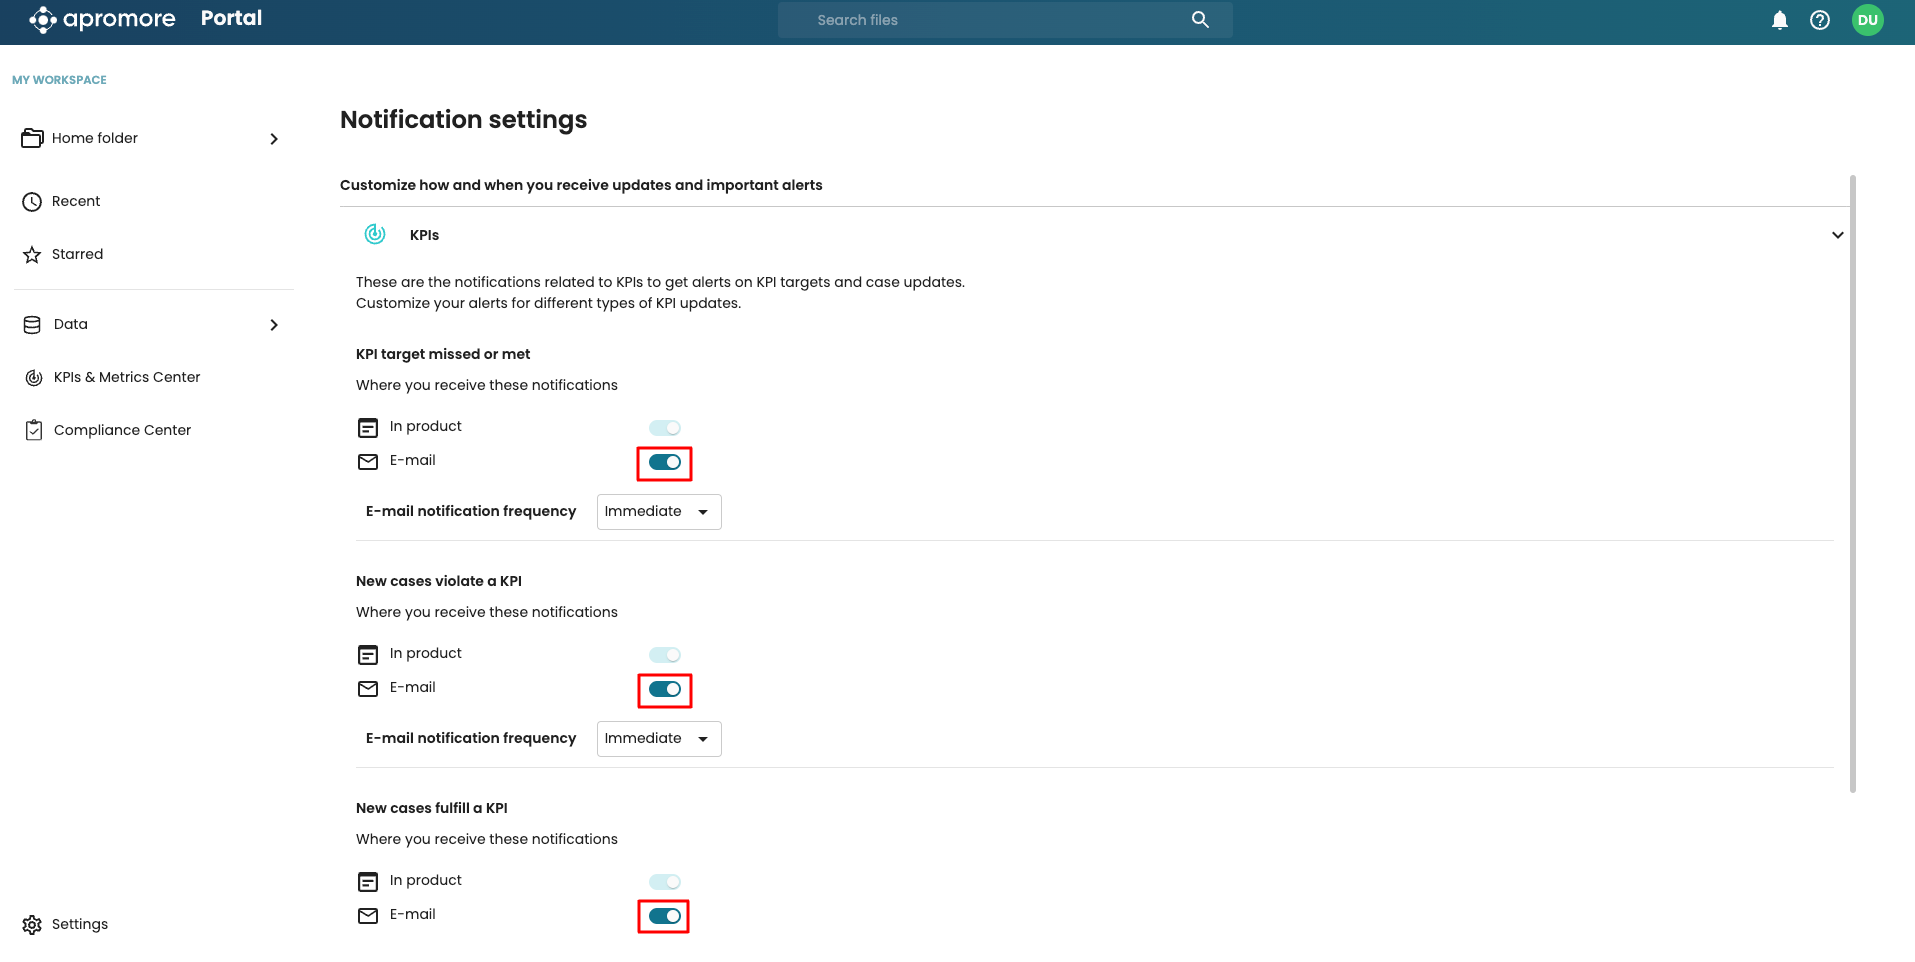
We can also receive email notifications for KPI breaches. Go to Notification settings, click KPIs, and toggle on the KPI notification of interest.
Note: Please contact your account executive to enable email notifications for KPIs.
Download and upload KPIs
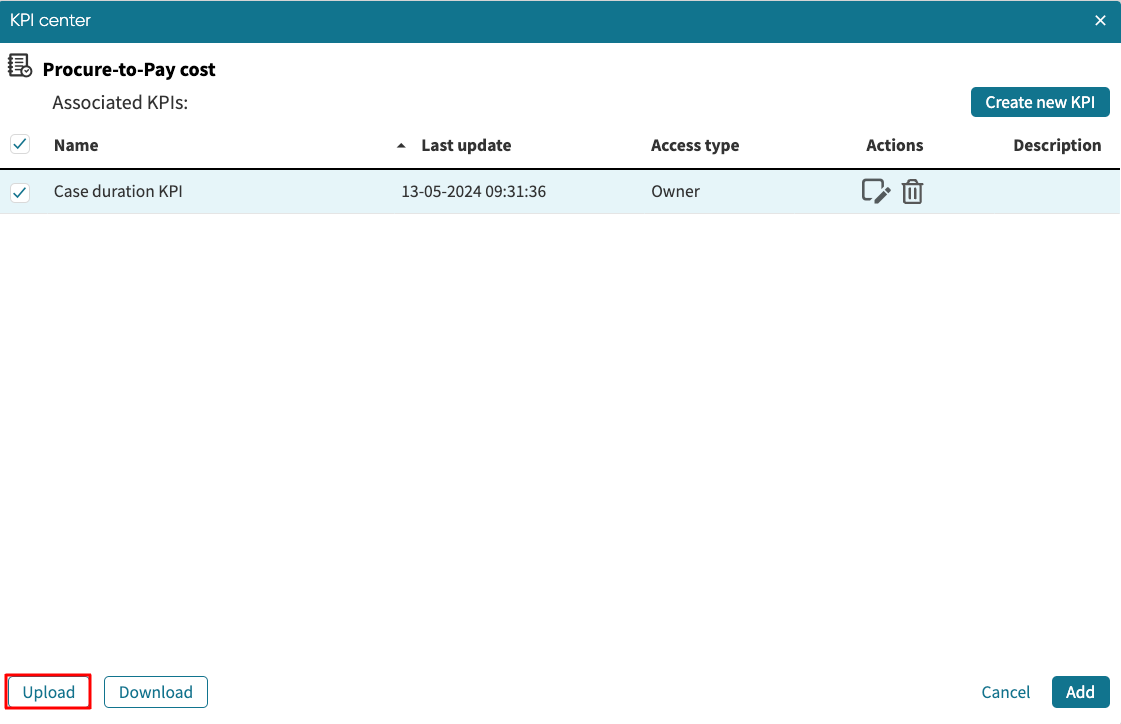
KPIs in the KPI center can be downloaded as a file. To download a KPI, open the KPI center. From Portal, right-click the log with the KPI and click KPIs. We see the KPIs attached to the log. Click Add to open the KPI center window.
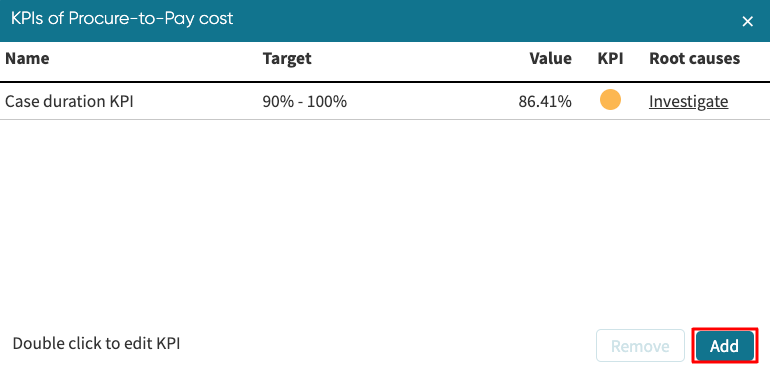
Click the KPI we wish to download and click Download.
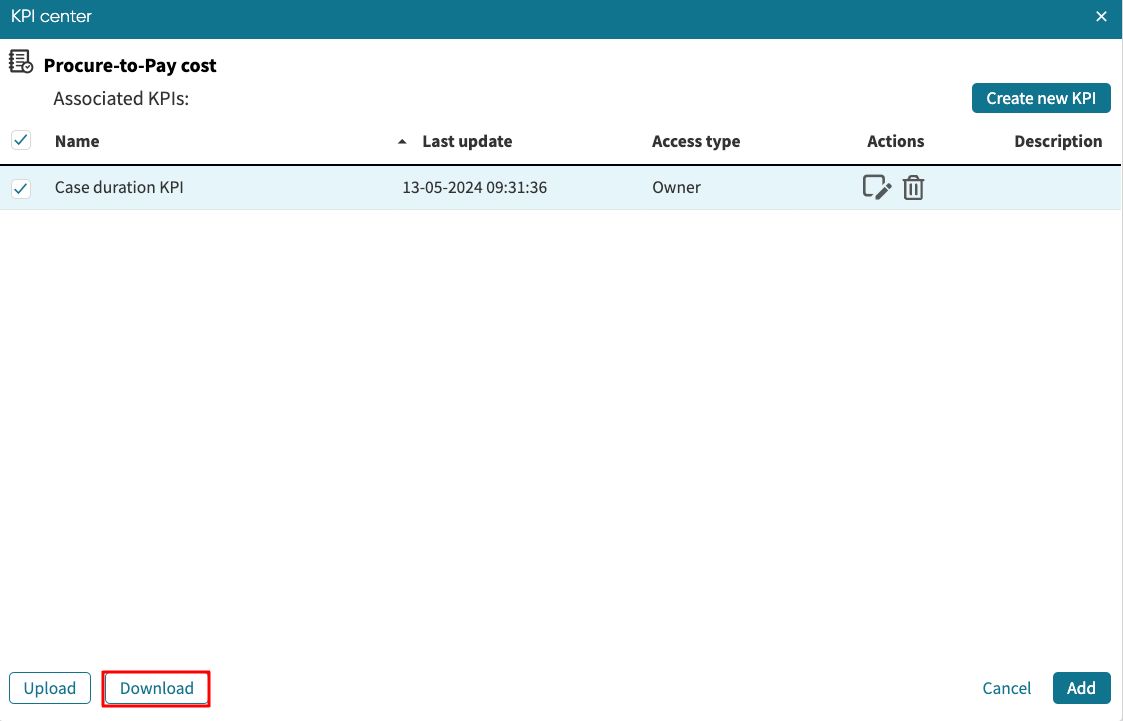
The KPI is downloaded as a zipped JSON file on our local machine.
Conversely, we can upload a KPI as a JSON file. To upload a KPI, click Upload in the KPI center.

Select the KPI as a JSON file we wish to upload. The file will be loaded to our KPI center.
Note
The upload and download KPI feature is currently unavailable in Apromore 10.1. It would be available in Apromore 10.2.
Use KPIs in Dashboards
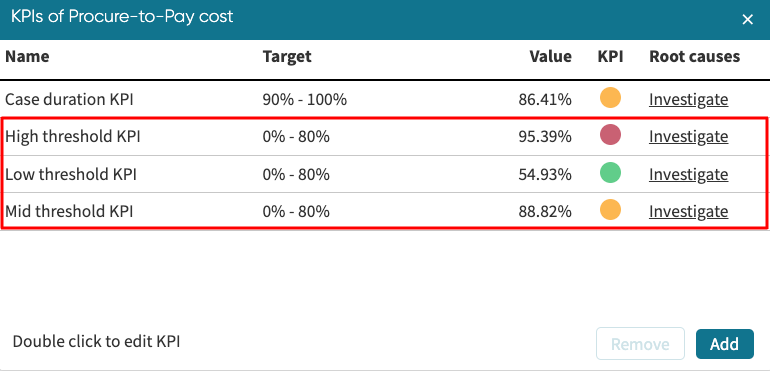
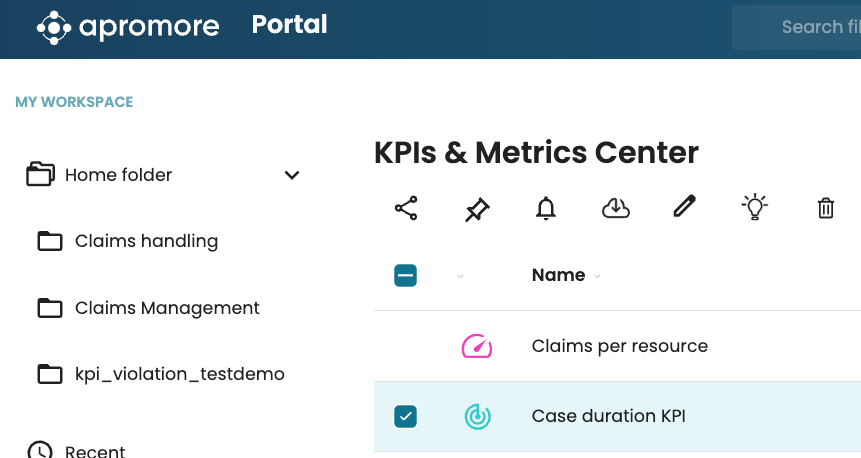
Apromore allows us to use KPIs in dashboards. Three other KPIs have been created and added to the KPI center to demonstrate the use of KPIs in dashboards. The KPIs are named Low threshold KPI, Mid threshold KPI, and High threshold KPI.
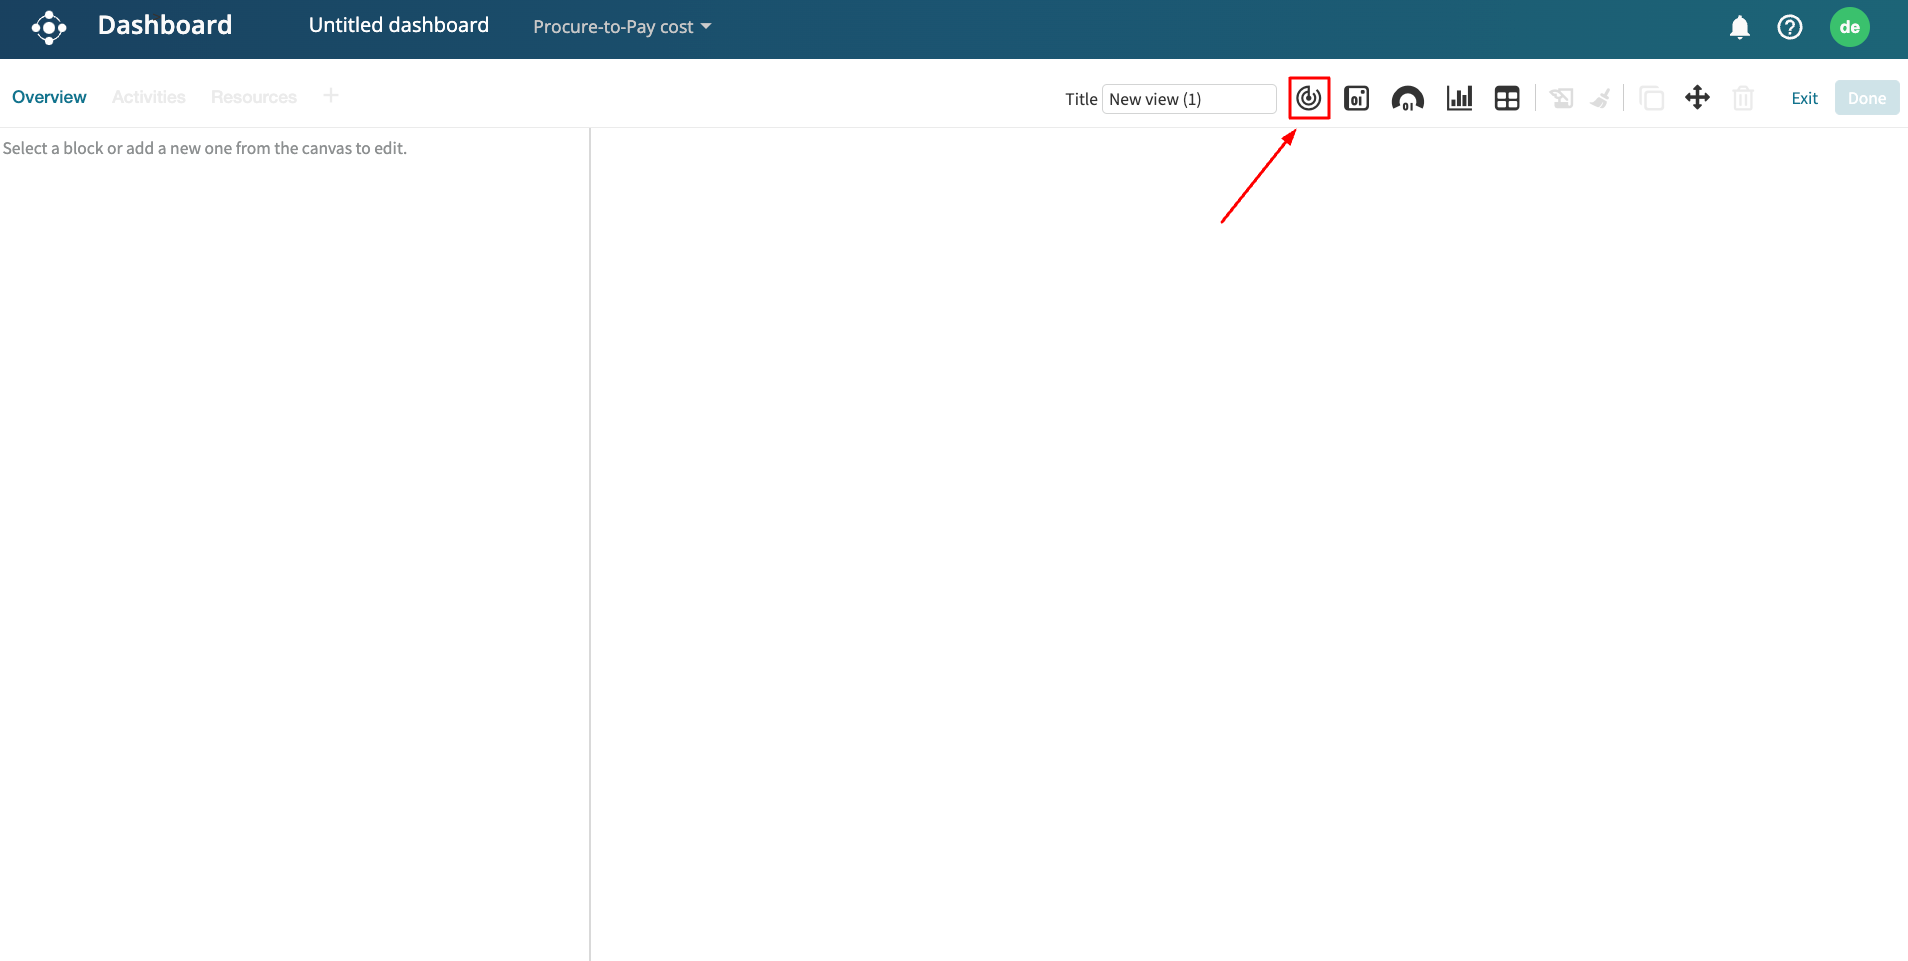
To use a KPI in a dashboard, create a new dashboard.
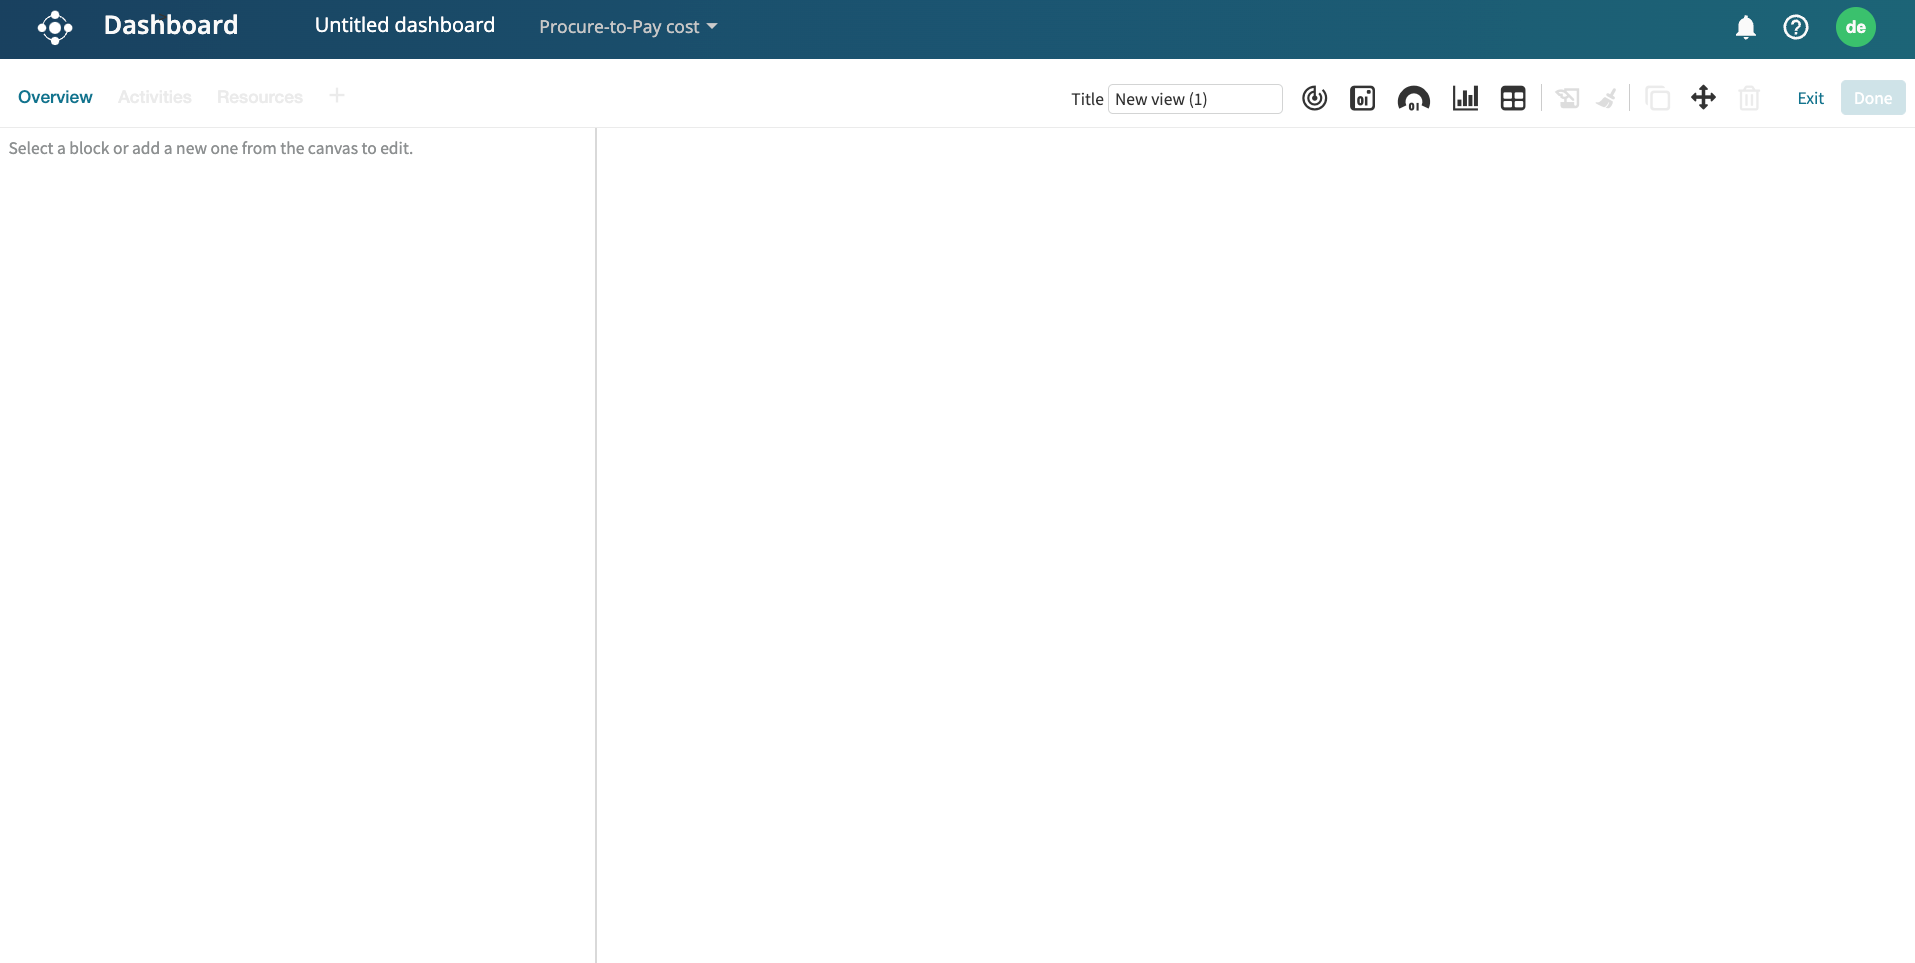
Click the Add KPI icon 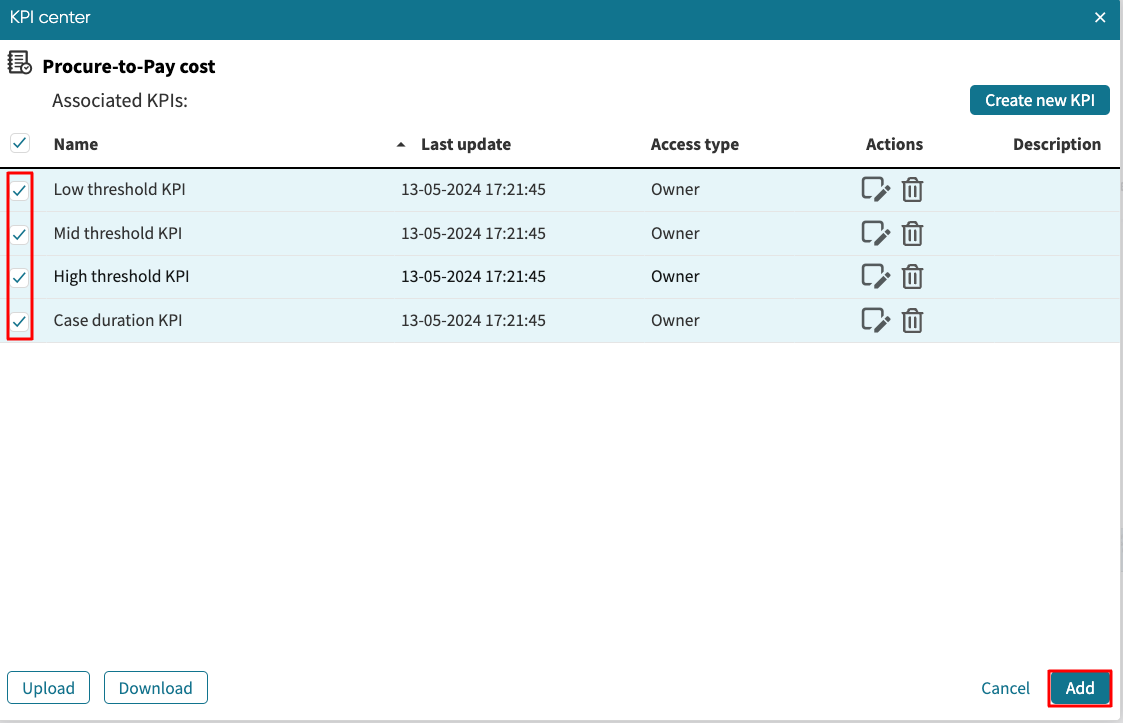 .
It adds one of the KPIs to the dashboard.
Click the KPI icon twice to add two more KPIs to the dashboard.
.
It adds one of the KPIs to the dashboard.
Click the KPI icon twice to add two more KPIs to the dashboard.
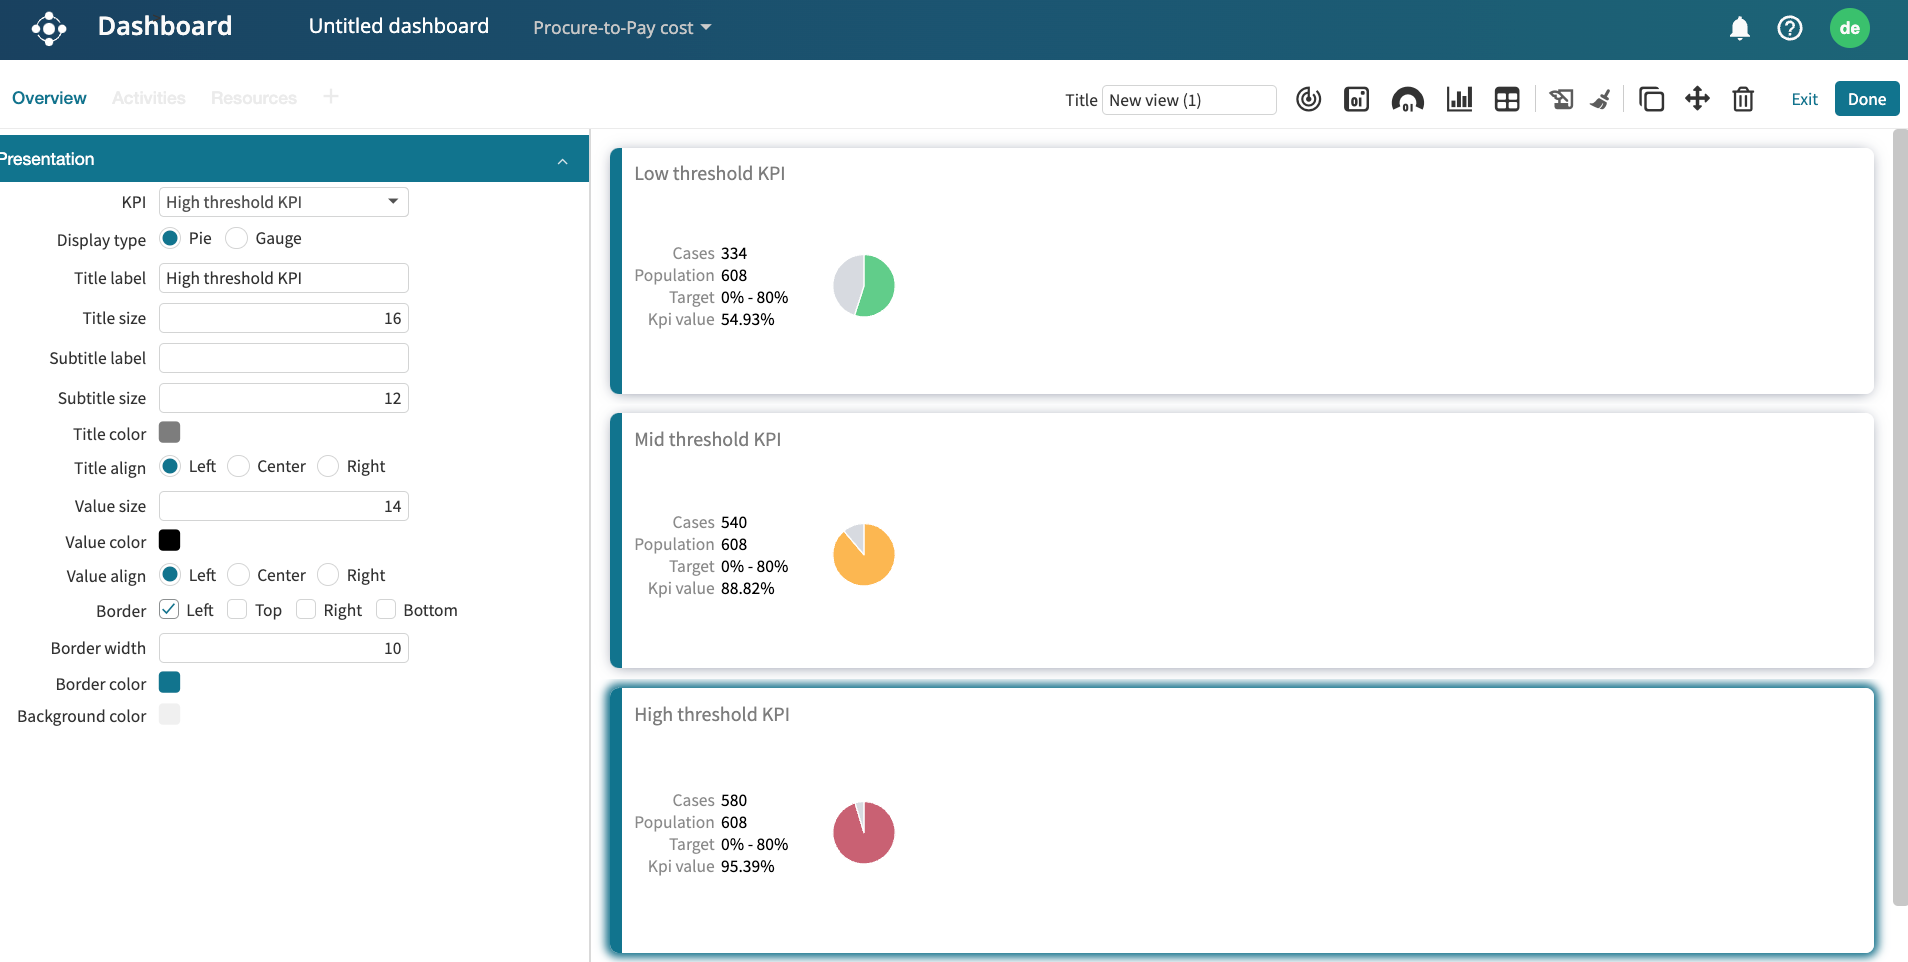
Click on a KPI to edit it. In the Presentation view, click the KPI dropdown to select a KPI we wish to display.
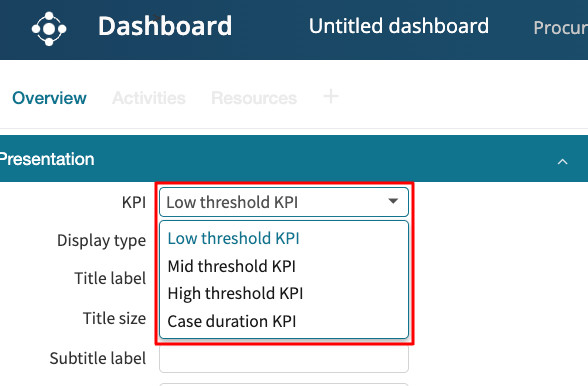
If we click Low threshold KPI, the KPI appears in the dashboard with its color code. We can repeat this for the other KPIs.
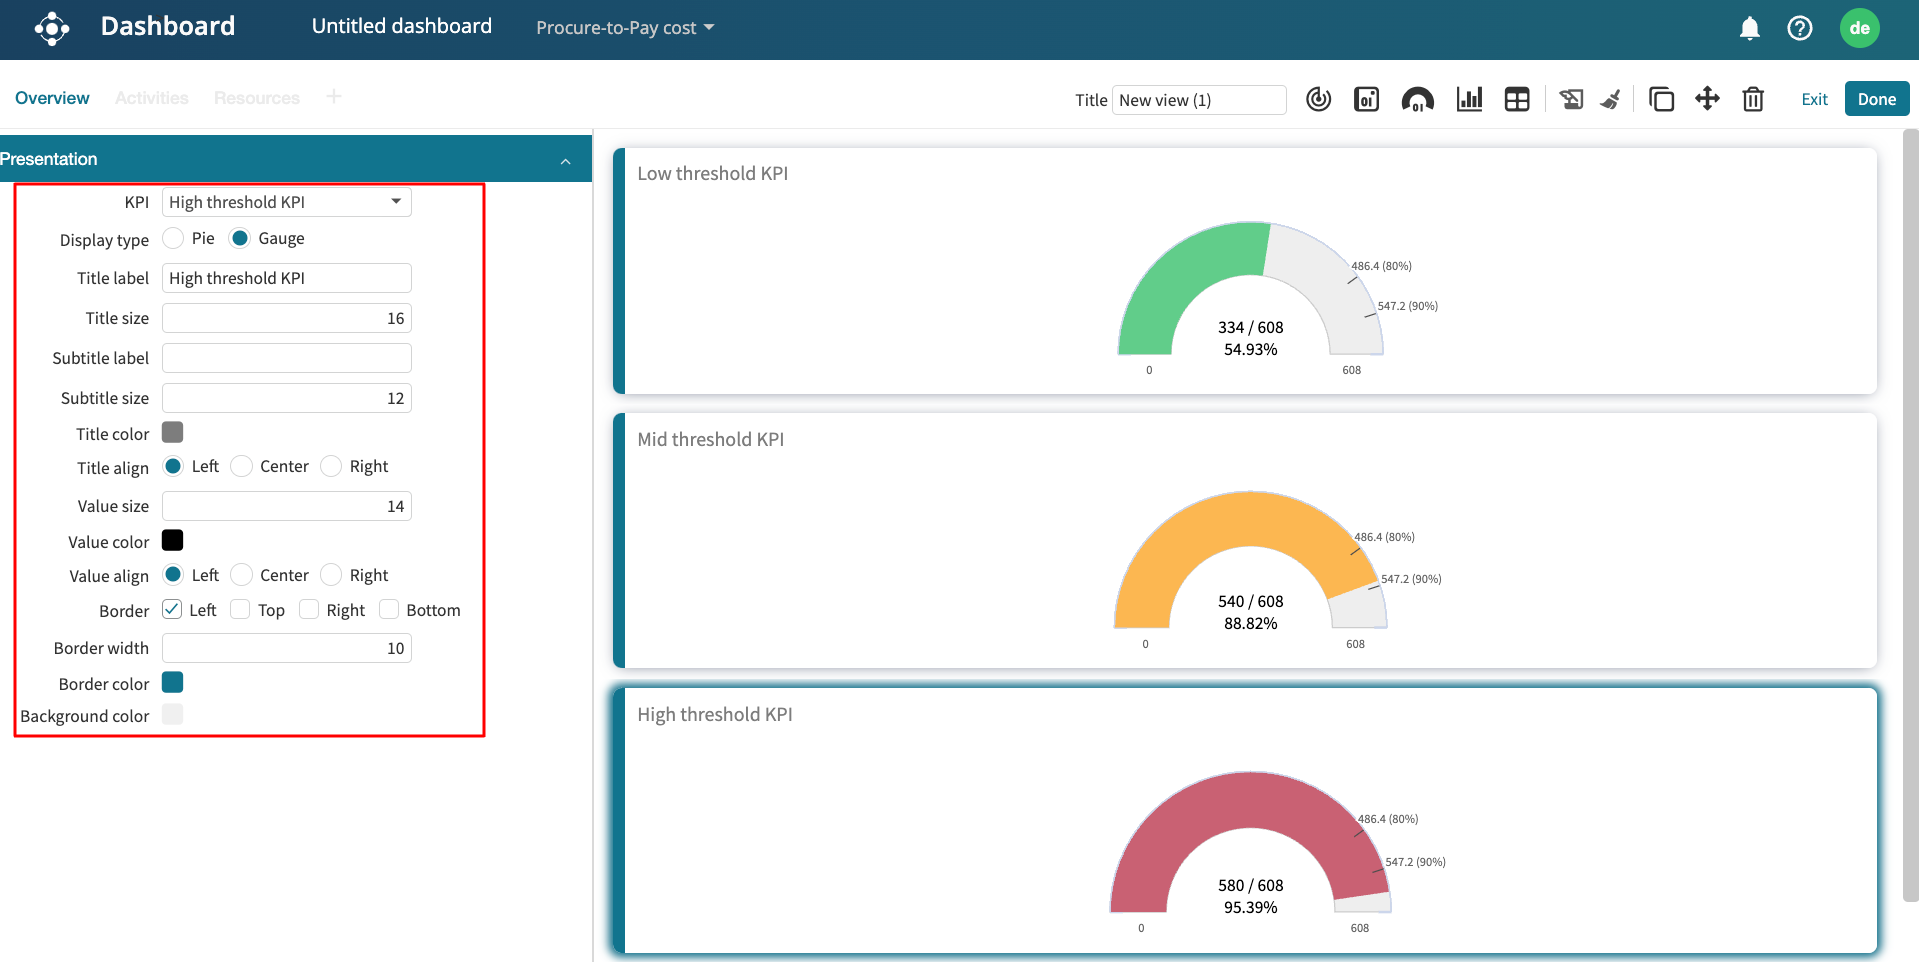
The KPIs can also be displayed as a gauge. Select Gauge as the display type.
Note
For a dynamic event log, i.e., when there is a defined ETL pipeline for the event log, the KPIs in the dashboard are automatically updated based on the current event log.
We can customize the visualization in the dashboard further using the settings in the presentation tab.

View KPIs from Process Discoverer
Apromore allows us to view the KPIs associated with a log from Process Discoverer.
To view the KPIs on a log, click the Manage KPIs icon  from Process Discoverer.
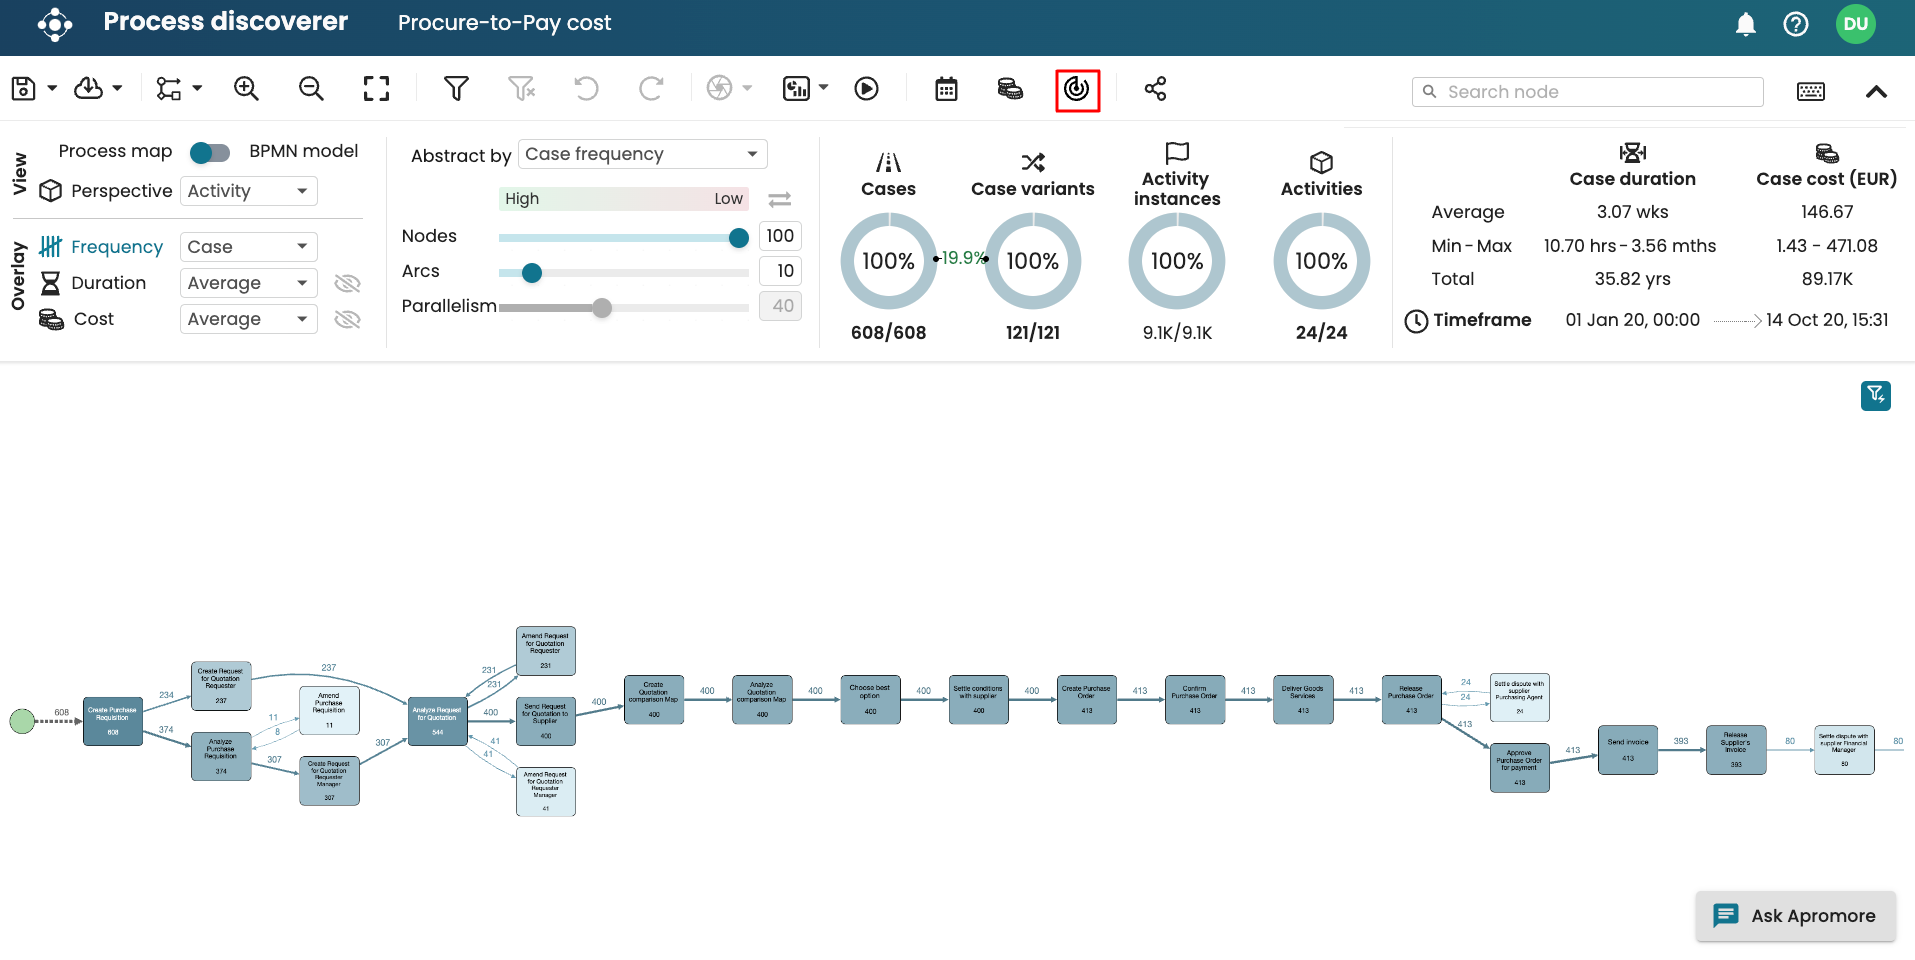
This displays the KPIs associated with that log alone.
Perform root cause analysis
As a process manager or analyst, when a KPI target is not met, we need to understand which cases are more likely to violate the KPI. This information can help us identify the causes of KPI violations and corrective actions.
To help in such investigations, the Root Cause Analyzer of the KPI Center displays a list of conditions under which the risk of KPI violation is considerably higher when this condition holds compared to when the condition does not hold.
For example, given a KPI that states that at least 95% of cases should have a duration below 12 days, the Root Cause Analyzer generates a list of statements such as the following:
The KPI violation rate when “Invoice Amount” >= 50K is 7% versus 3% otherwise.
The KPI violation rate when “Country” is “Canada” is 2% versus 6% otherwise.
The first of these statements indicates a negative deviance: the subpopulation of cases where the Invoice Amount is above 50K needs further attention. The second statement indicates positive deviance: The cases in Canada are handled more efficiently than others, suggesting that there is something to learn from how cases are handled in Canada.
We can sort the findings based on several metrics that are common in the field of risk analysis:
Violation rate: The percentage of cases in the KPI’s population that fulfill the condition and violate the KPI. In the first of the above examples, the conditional KPI violation rate for the condition “Country” is “Canada” is 2%.
Inverse violation rate: The percentage of cases in the KPI’s population that do NOT fulfill the condition and violate the KPI. In the first of the above examples, the inverse KPI violation rate for the condition “Country” is “Canada” is 6%.
Risk increase: The difference between the KPI violation rate and the inverse KPI violation rate. A risk increase of 5% tells us that if a case fulfills the condition, the probability of this case violating the KPI is 5 percentage points higher than if it does not.
Risk ratio: The ratio of the KPI violation rate to the inverse KPI violation rate. A risk ratio of 2 tells us that cases that fulfill the condition are twice more likely to violate the KPI than cases that do not.
Sub-population: The number of cases in the KPI population that fulfill the condition.
Sub-population percentage: The percentage of the subpopulation size to the KPI’s population.
A finding is negative if the risk increase is positive. In this case, the finding tells us that a condition under which the KPI violation rate increases. Conversely, a finding is positive if the risk increase is negative (the finding suggests a condition under which the KPI violation rate decreases).
The Root Cause Analyzer retrieves the findings that are most “informative”. The informativeness of a finding is measured using decision tree mining techniques.
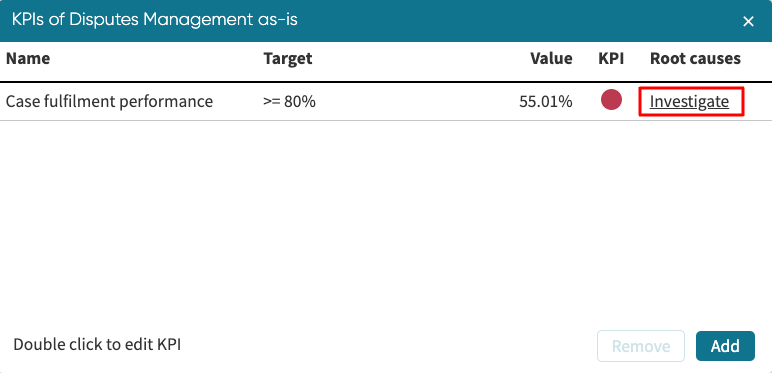
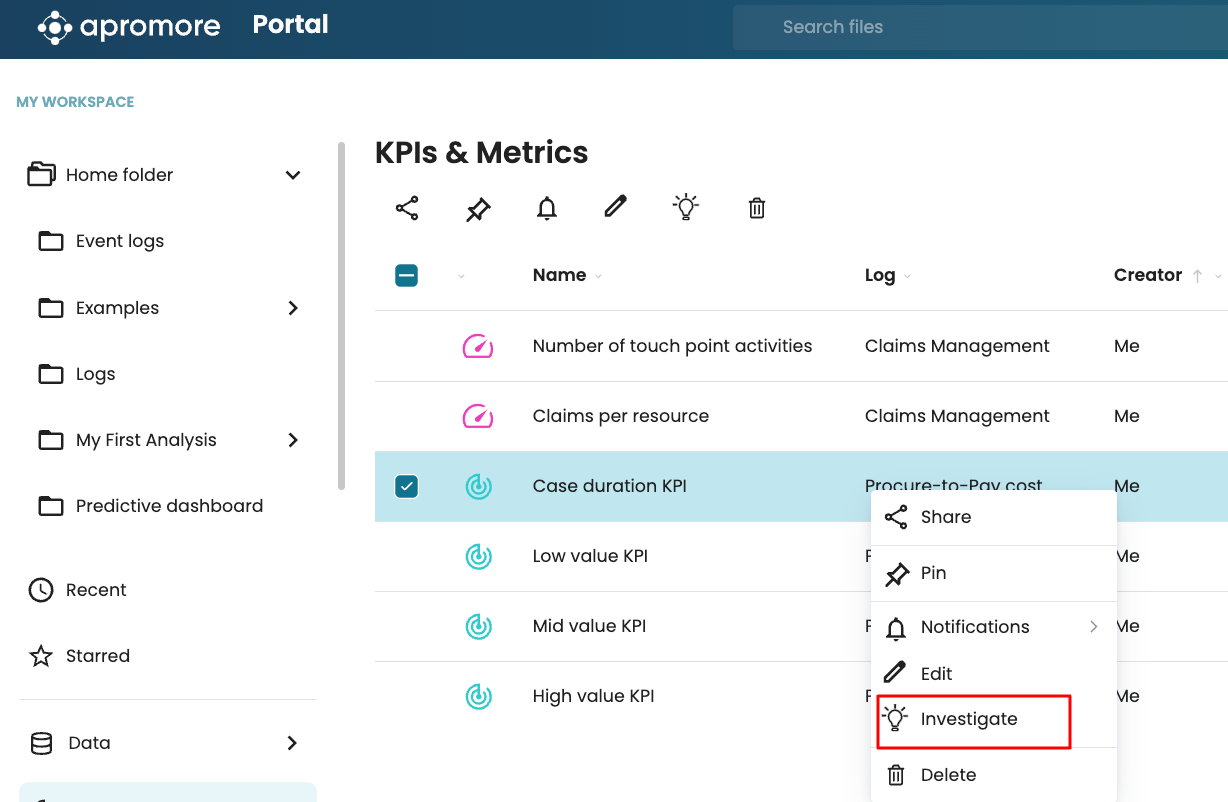
To investigate the possible root causes of KPI violations, go to KPIs & Metrics. Right-click the KPI and click Investigate.
In our example, we have defined a KPI, “Case duration KPI”, that flags cases with a case duration greater than 12 weeks.
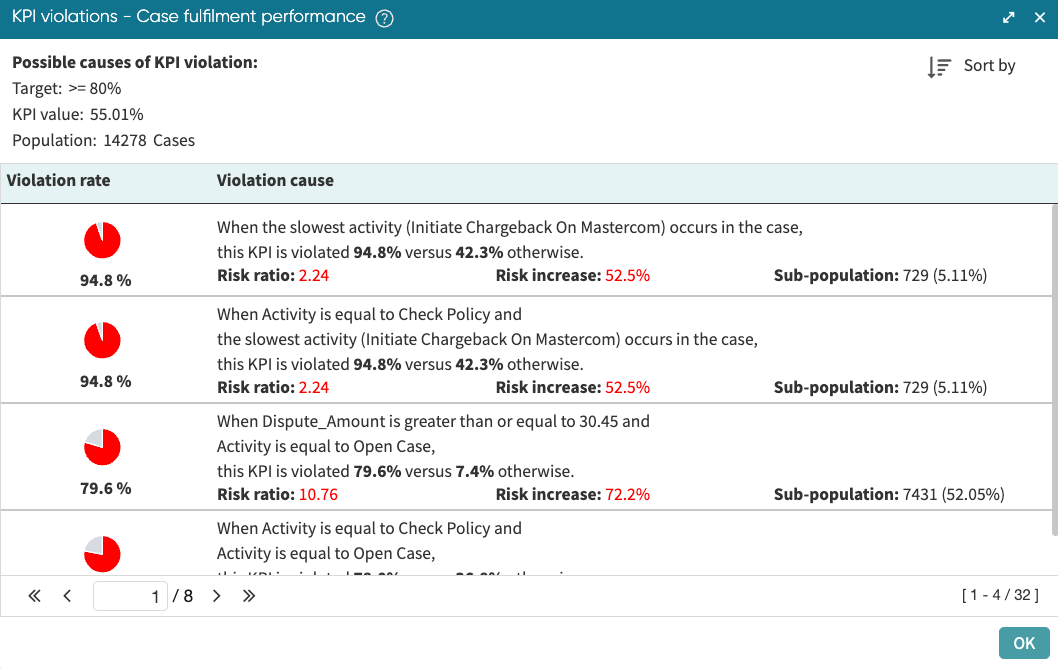
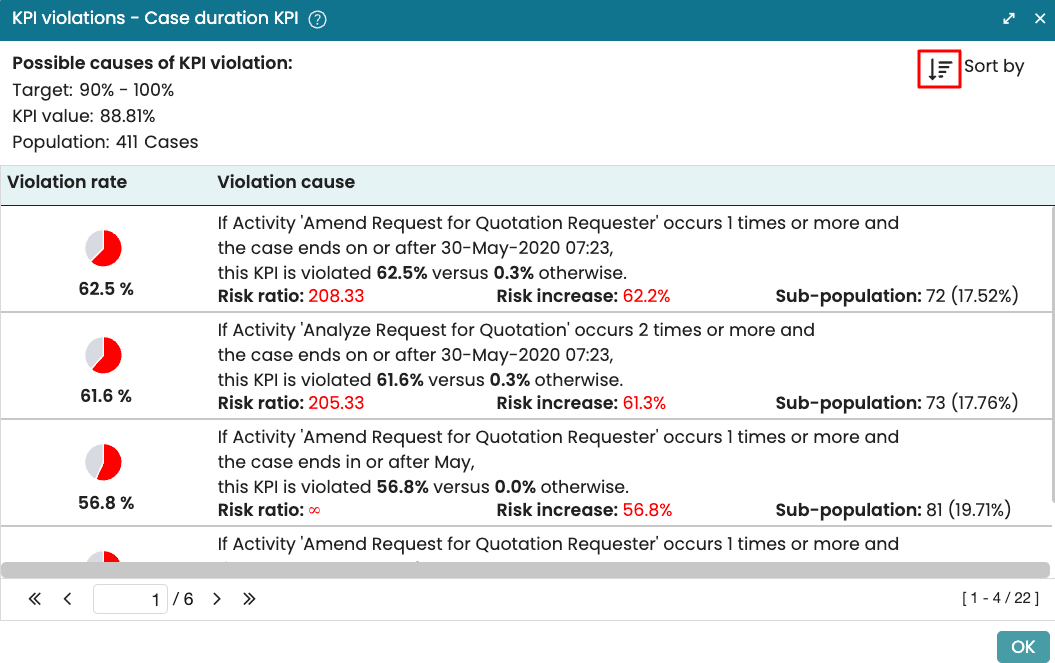
This opens the KPI Root Cause Analyzer window for the selected KPI.

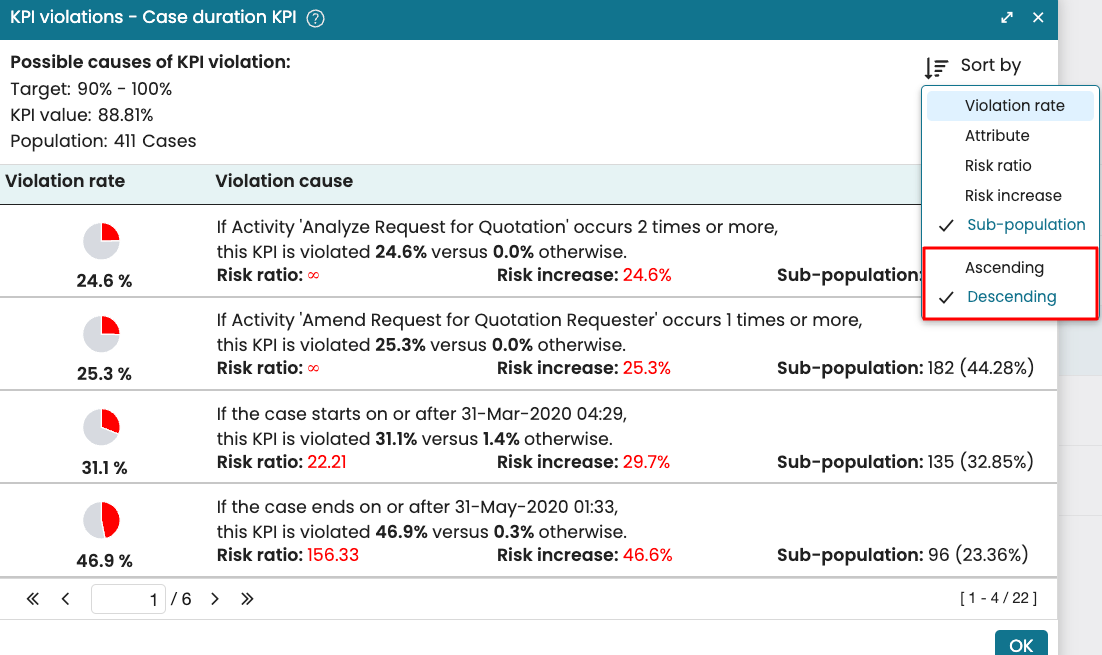
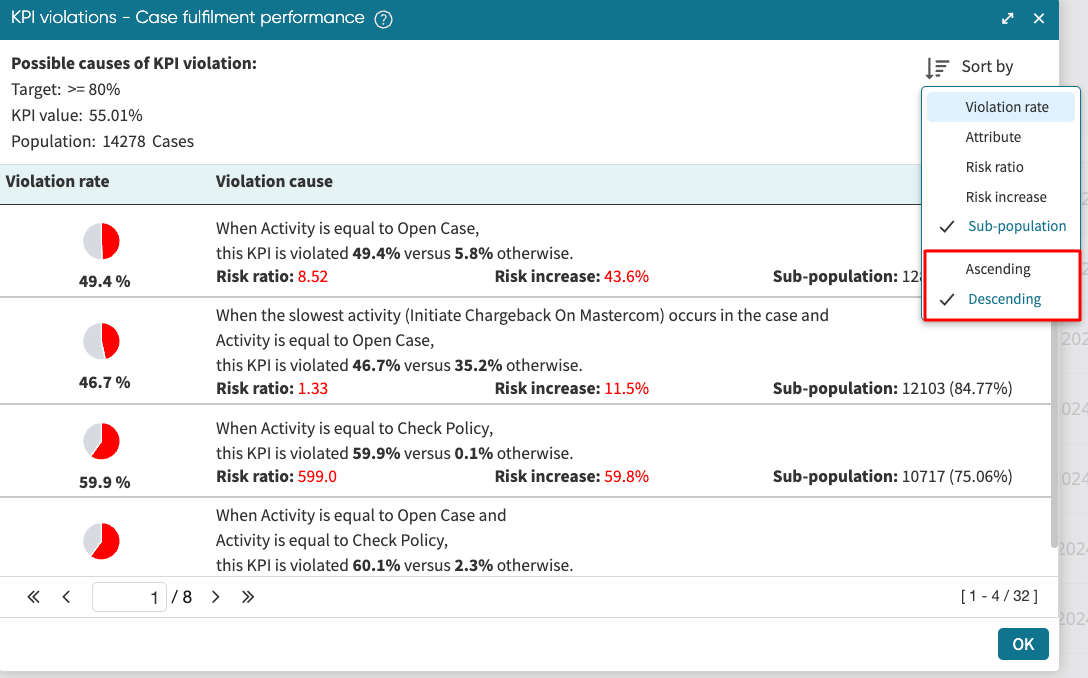
The KPI Root Cause Analyzer window displays a list of “findings”. Each finding appears as a card and consists of a textual description. The metrics of this finding are risk ratio, risk increase, subpopulation size, and subpopulation percentage. Note that the KPI violation rate and the inverse KPI violation rate are included in the description. This helps us understand specific contributing factors to the KPI violations.
We can sort the list of findings in ascending or descending order according to:
Violation rate
Attribute name
Risk ratio
Risk increase
Sub-population
To change how the findings are sorted, click the Sort by icon.
Select the metric by which we wish to sort.
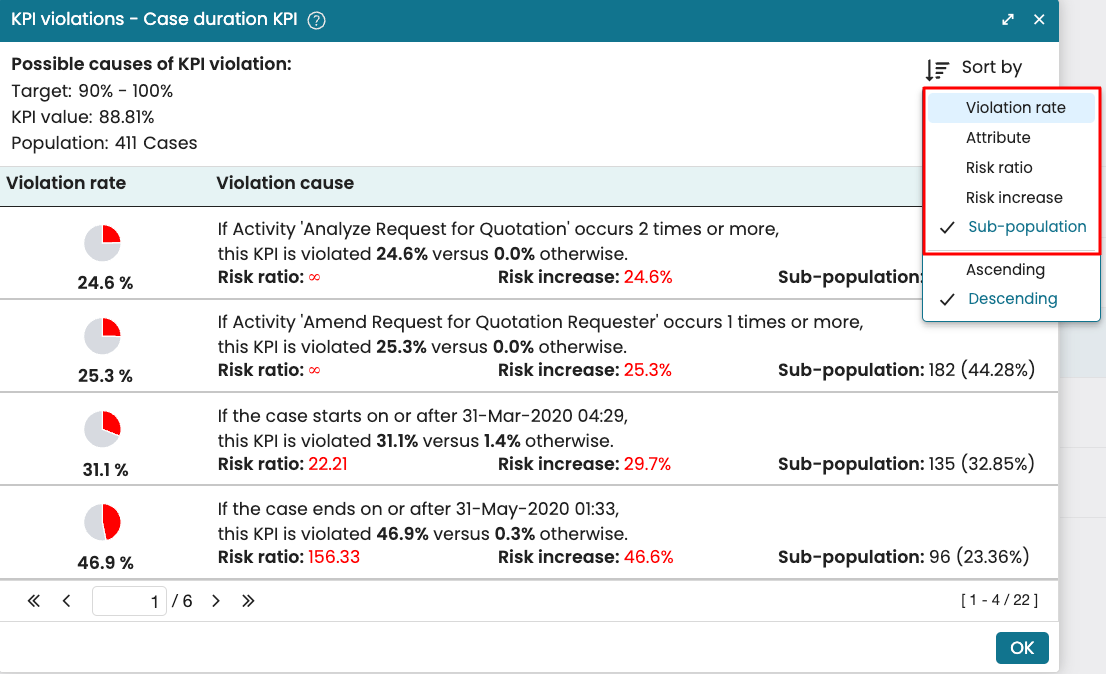
To sort in ascending or descending order, click the Sort by icon  .
Select Ascending or Descending.
.
Select Ascending or Descending.
The findings are now listed by the selected metric in ascending or descending order.