Manage metrics
Apromore offers a wide range of metrics, such as average duration, case utilization, total rework, etc., for various performance mining tasks. However, there are situations where these metrics do not capture the specific insight we need. For instance, in a claims handling process, we may want to track the number of claims done per resource within a given period of time. This could help identify resource bottlenecks and balance workloads in the process. To enable us to create such a unique metric, we can now create a custom metric by combining attributes in our event log.
Custom metric allows us to define our own performance metric by combining values and attributes in the event log into formulas.
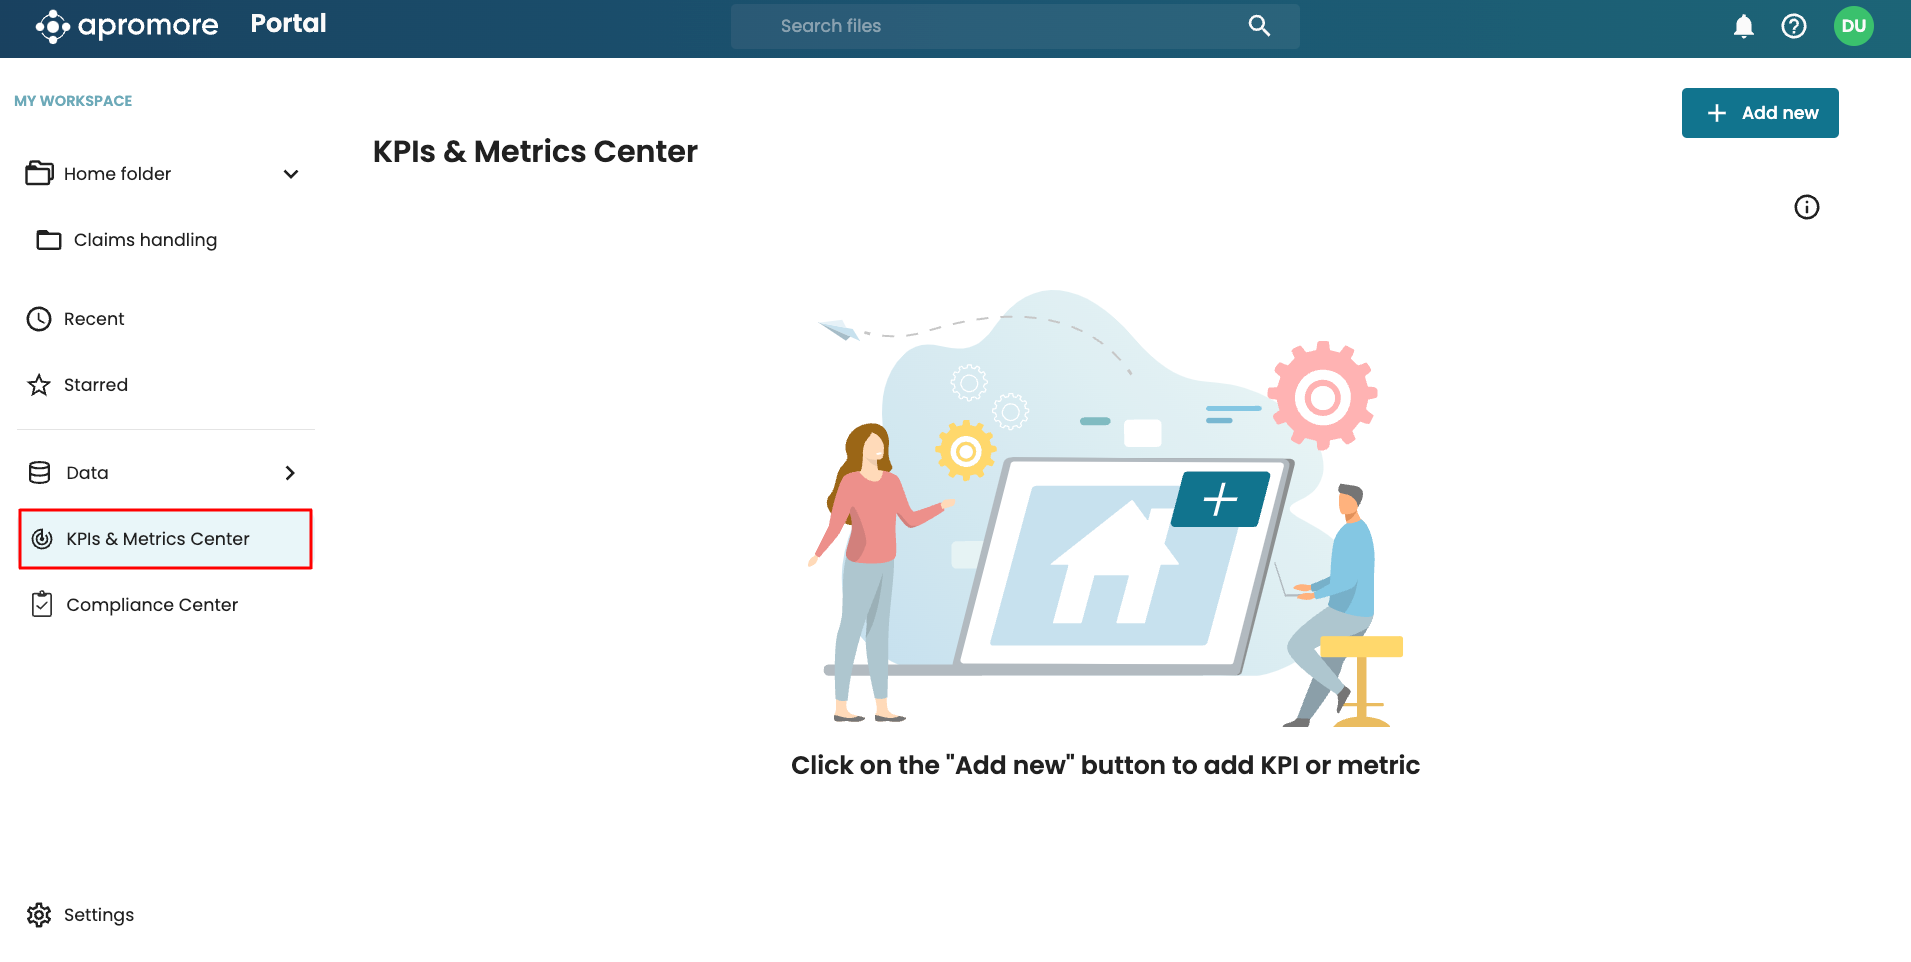
Let us say we wish to create a metric that displays the number of claims per resource. From Portal, go to KPIs & Metrics.
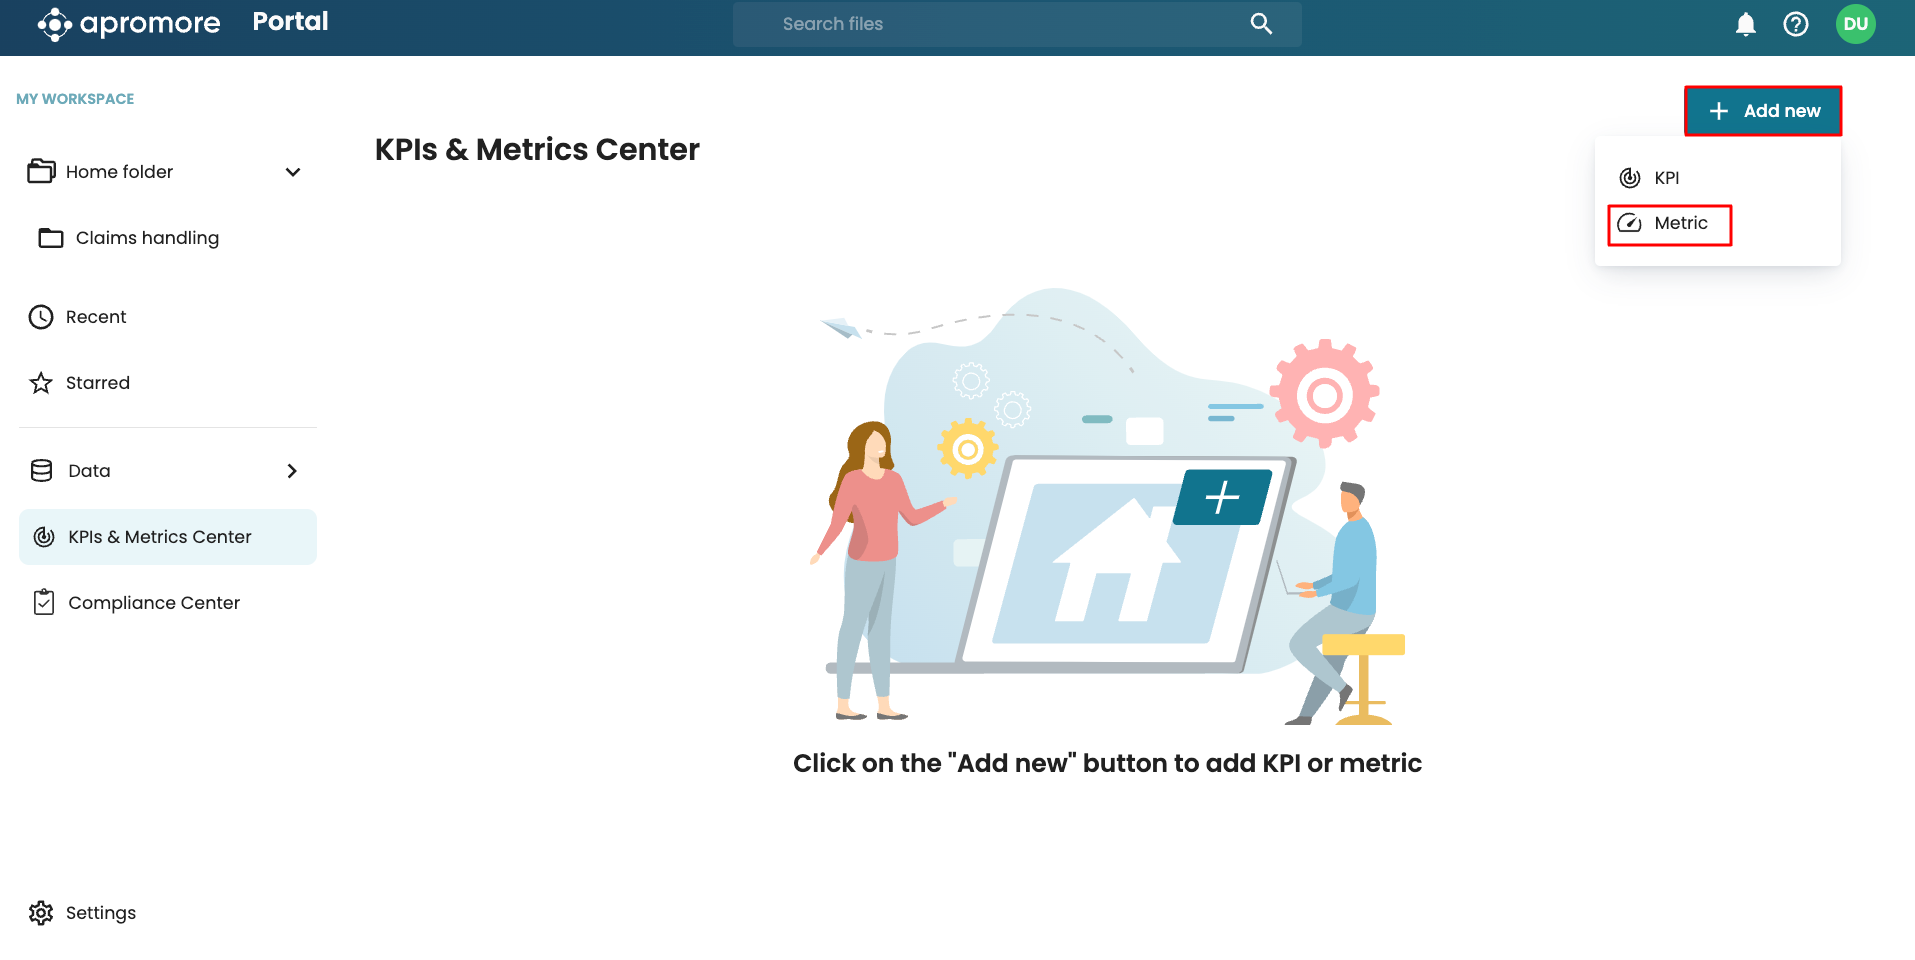
To add a new custom metric, click Add new > Metric.
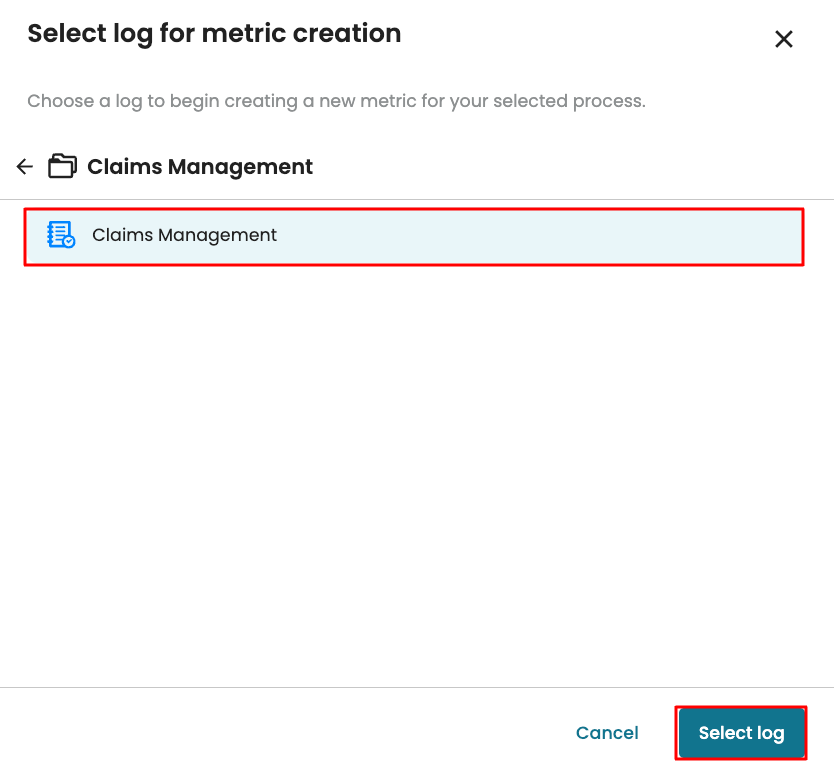
Select the log the metric will be created on and click Select log.
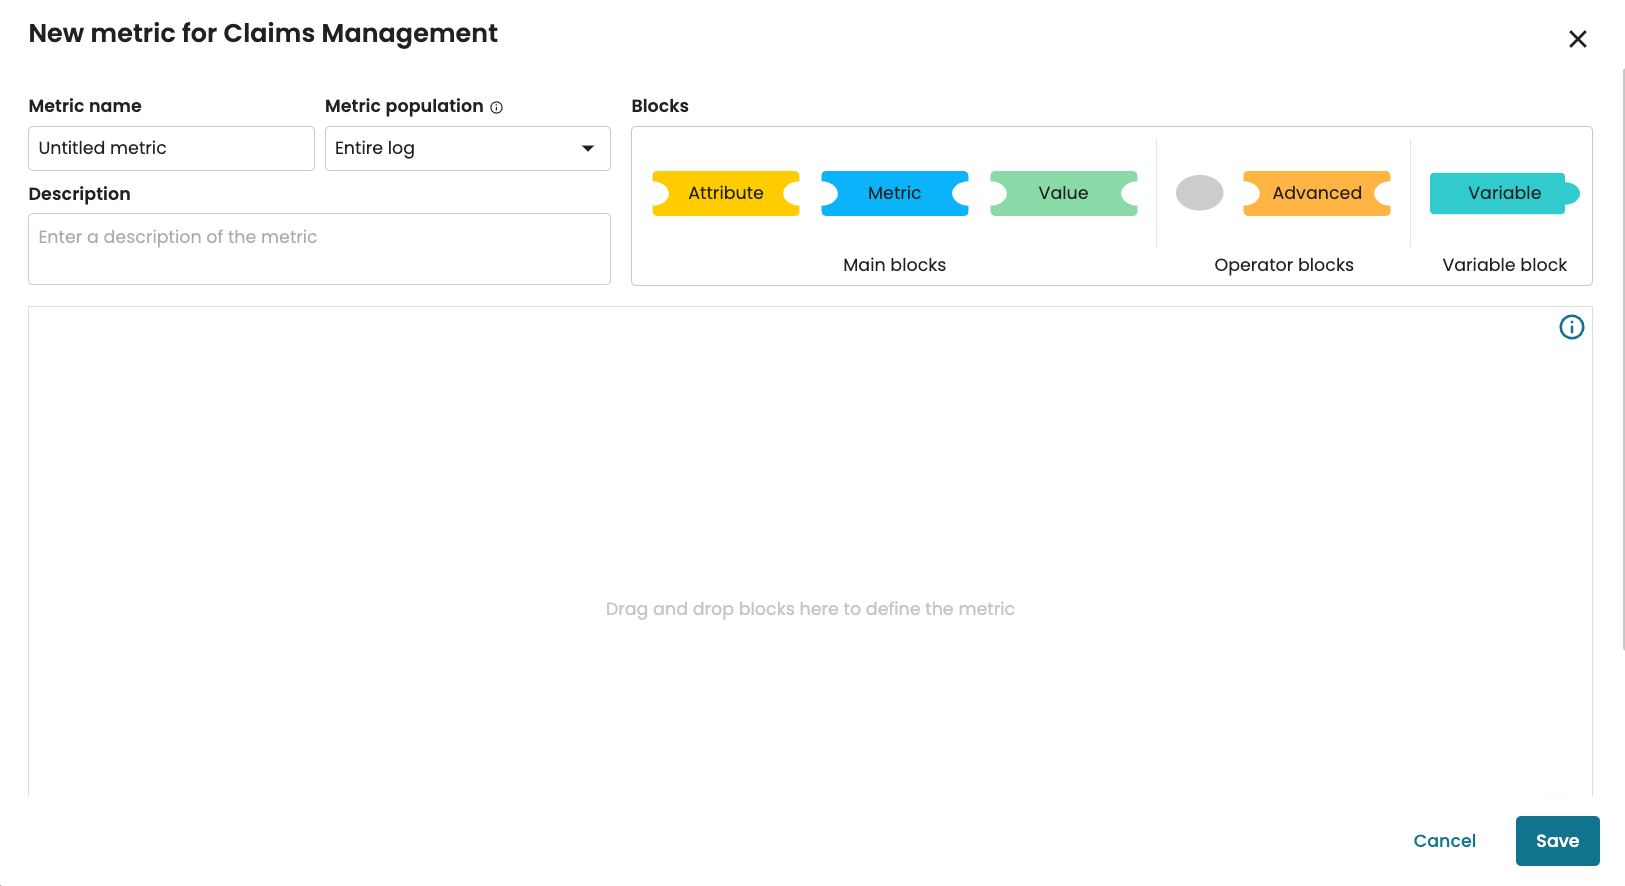
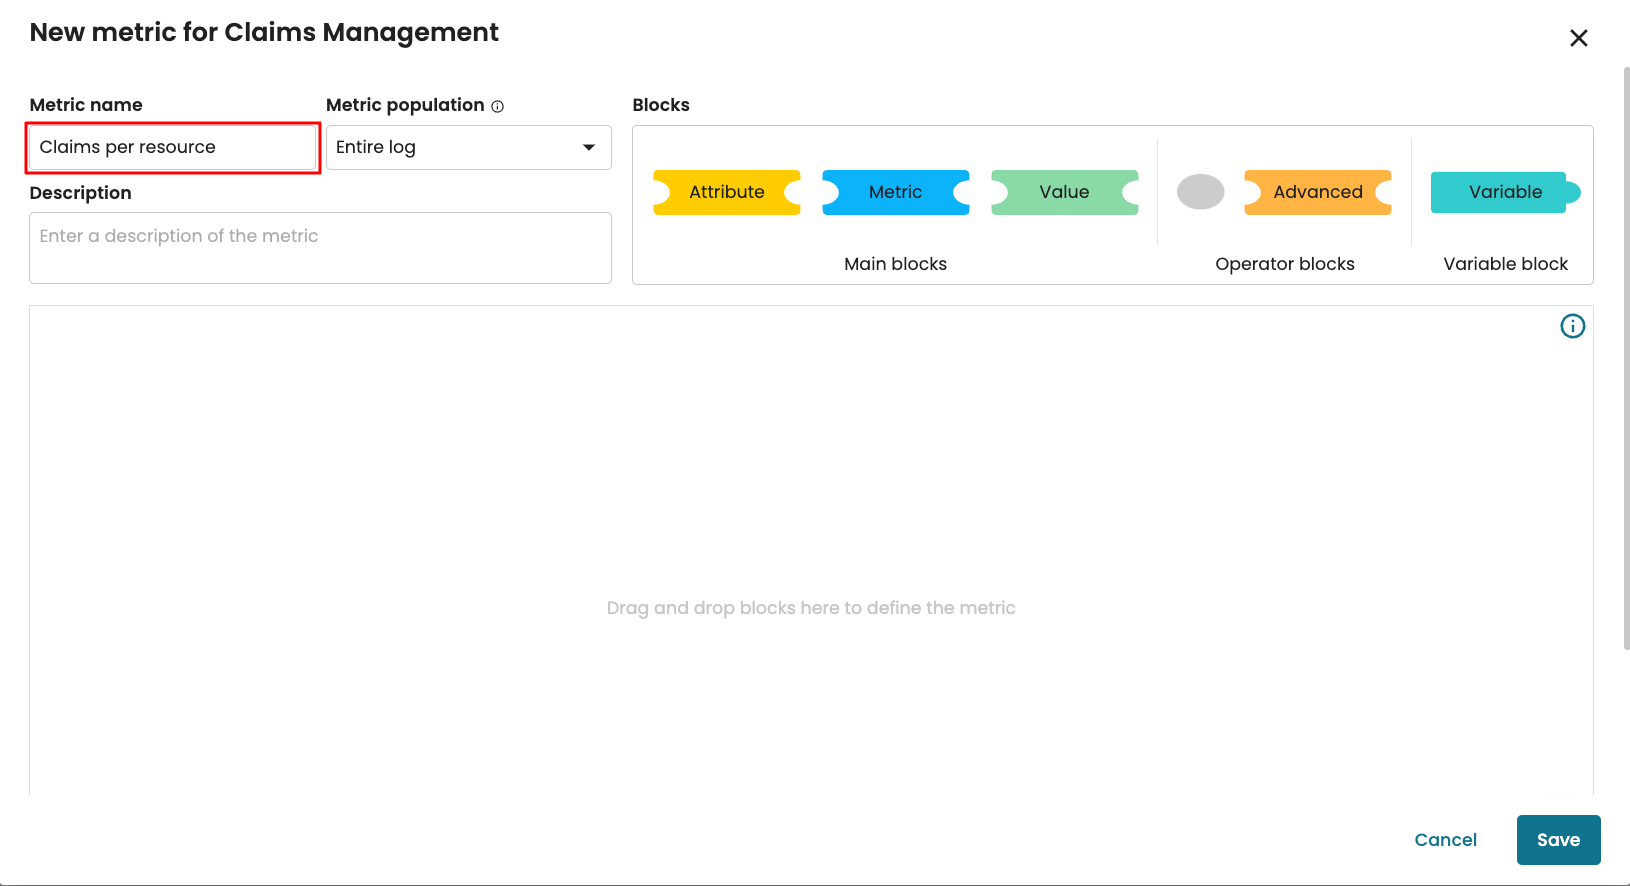
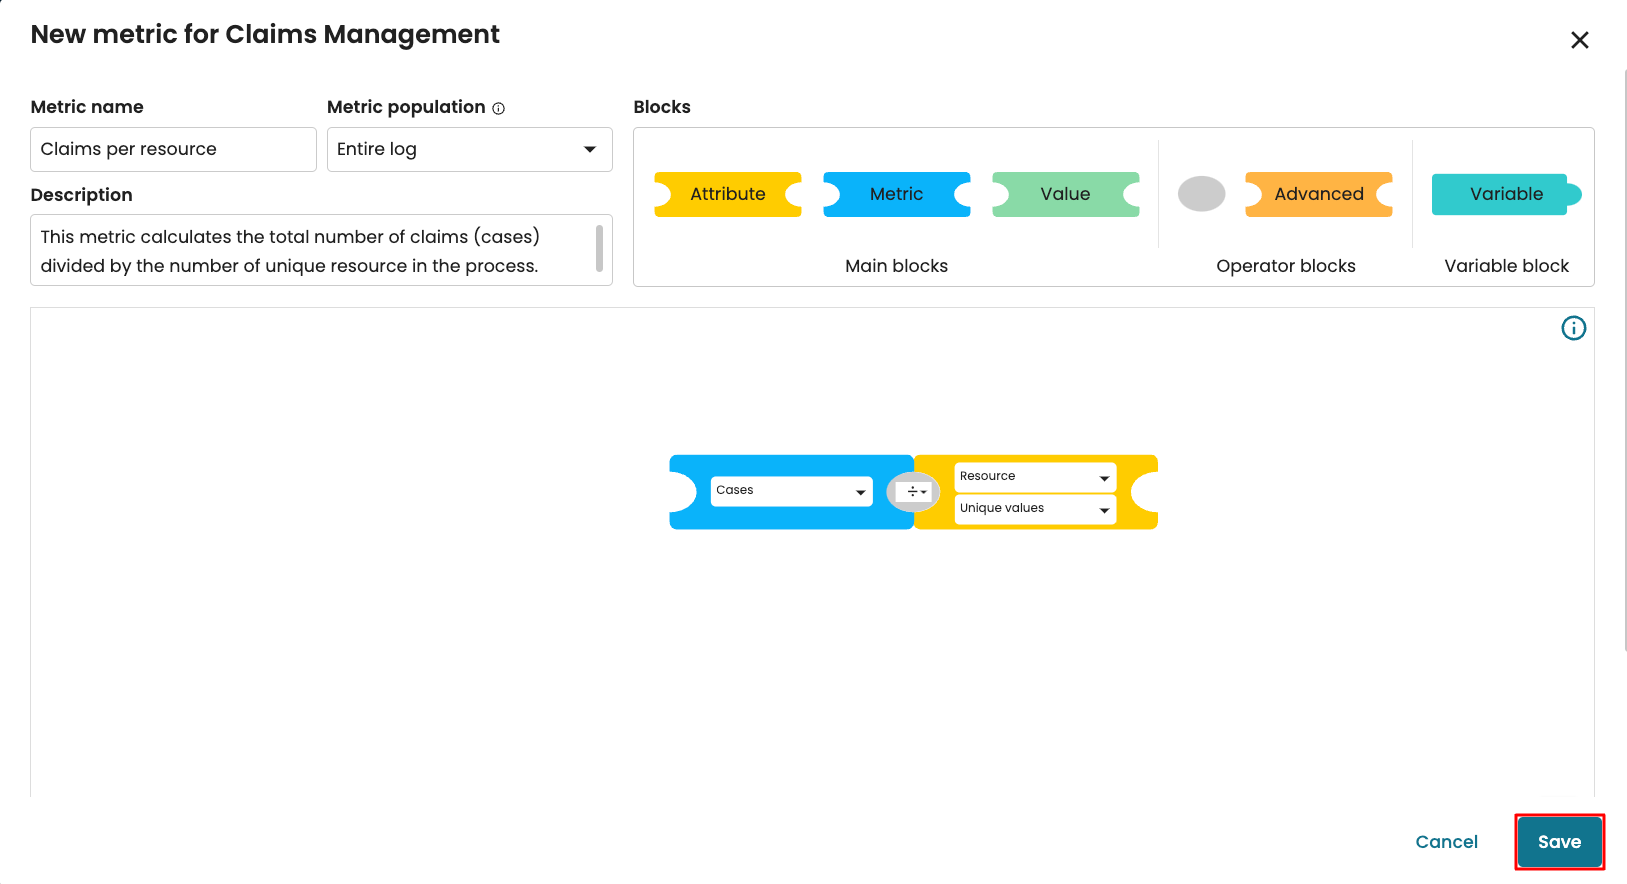
We see the New metric window where we can define our custom metric.
First, define the metric name.
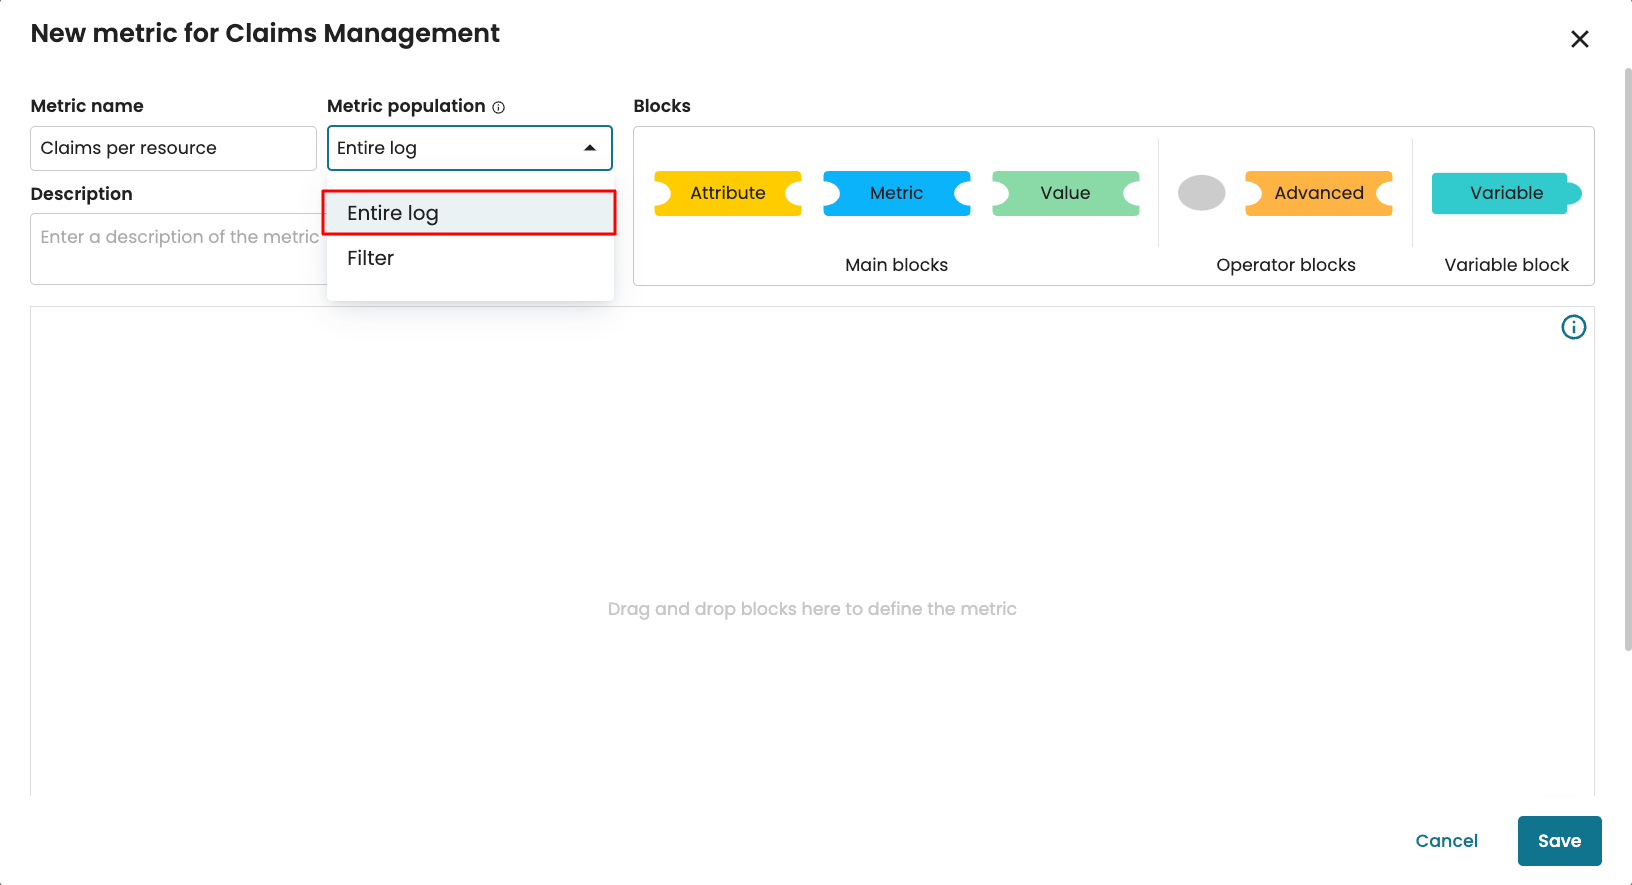
Next, we specify the metric population. The metric population can either be the entire log or a filtered log.
Entire log: The metric will be calculated on values in the entire log.
Filter: The metric will be calculated based on the filtered log. For instance, in a situation where we want to define a metric that calculates the number of customer touchpoints per case, we need to create the metric on a filtered log. The filter will retain only events that are considered touchpoint activities.
In our case, we apply the metric to the entire log.
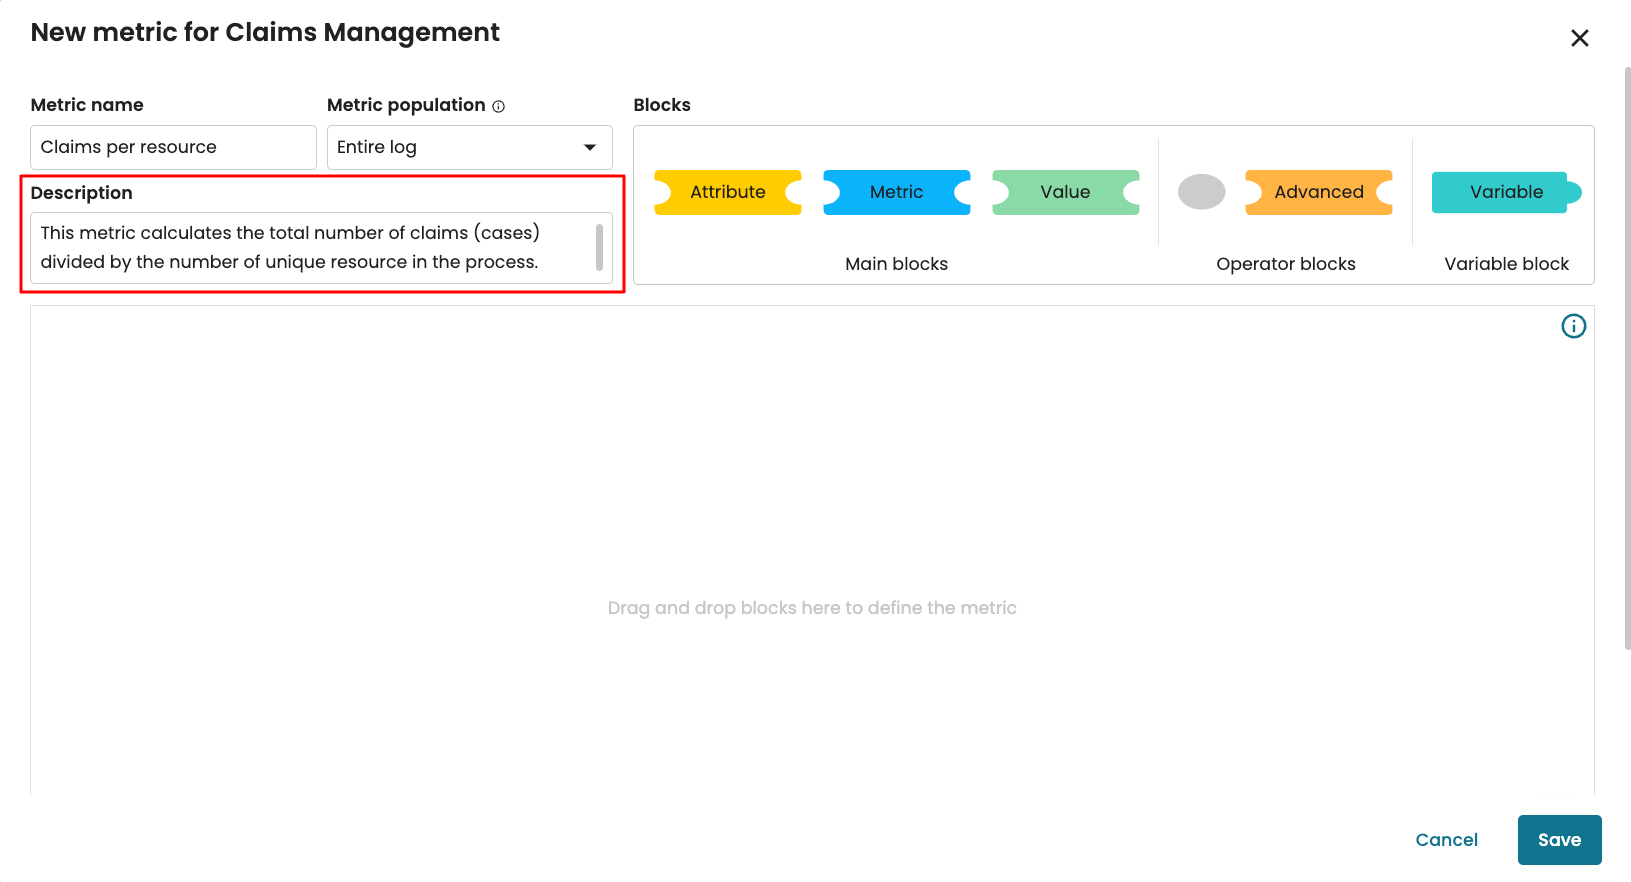
We can optionally add a description for the metric.
Finally, we use the blocks to specify the metric we wish to calculate. There are three types of blocks.
Main blocks: This contains the attribute, metric, and value blocks.
Attribute block: The attribute block allows us to create the metric from attributes in the event log. The attribute can be the activity, role, resource, end time, etc.
Metric block: The metric block allows us to create the metric from predefined metrics in Apromore. Predefined metrics include the number of cases, case length, waiting time, case utilization, etc.
Value block: This allows us to enter numbers when a metric.For instance, if the process involves a period of 12 months and we wish to find the metric value per month, we can divide the formula by 12.
Operator blocks: The operator block consists of the mathematical operator block and the advanced block.
Mathematical operator: This is the gray, oval-shaped block.It allows us to combine multiple blocks with addition subtraction, division, or multiplication (+, -, ÷, ×) operators.
Advanced operator: This allows us to use other mathematical operators such as square root, absolute value, power, etc. Note that when an advanced block is selected, it is used alongside a main block.
Variable block: A variable block is used to simplify a complex metric. In the variable block, we can define a sub-metric (called a variable) that can be reused in the main metric block. Note that variable blocks are created separately. After a variable block is created, its name becomes available for use in the main block.
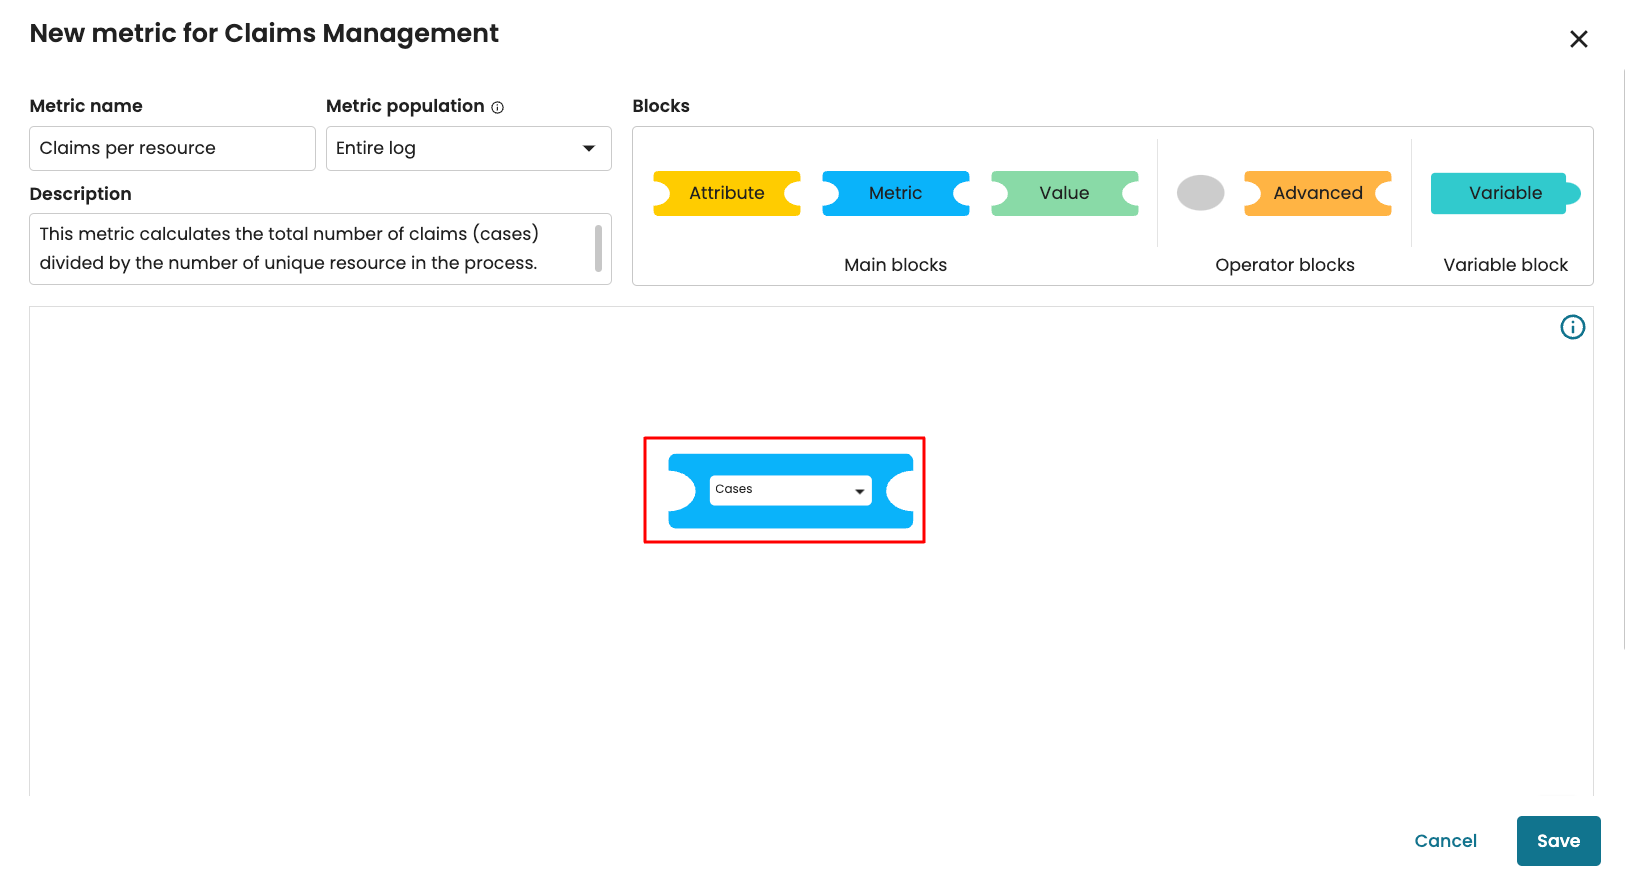
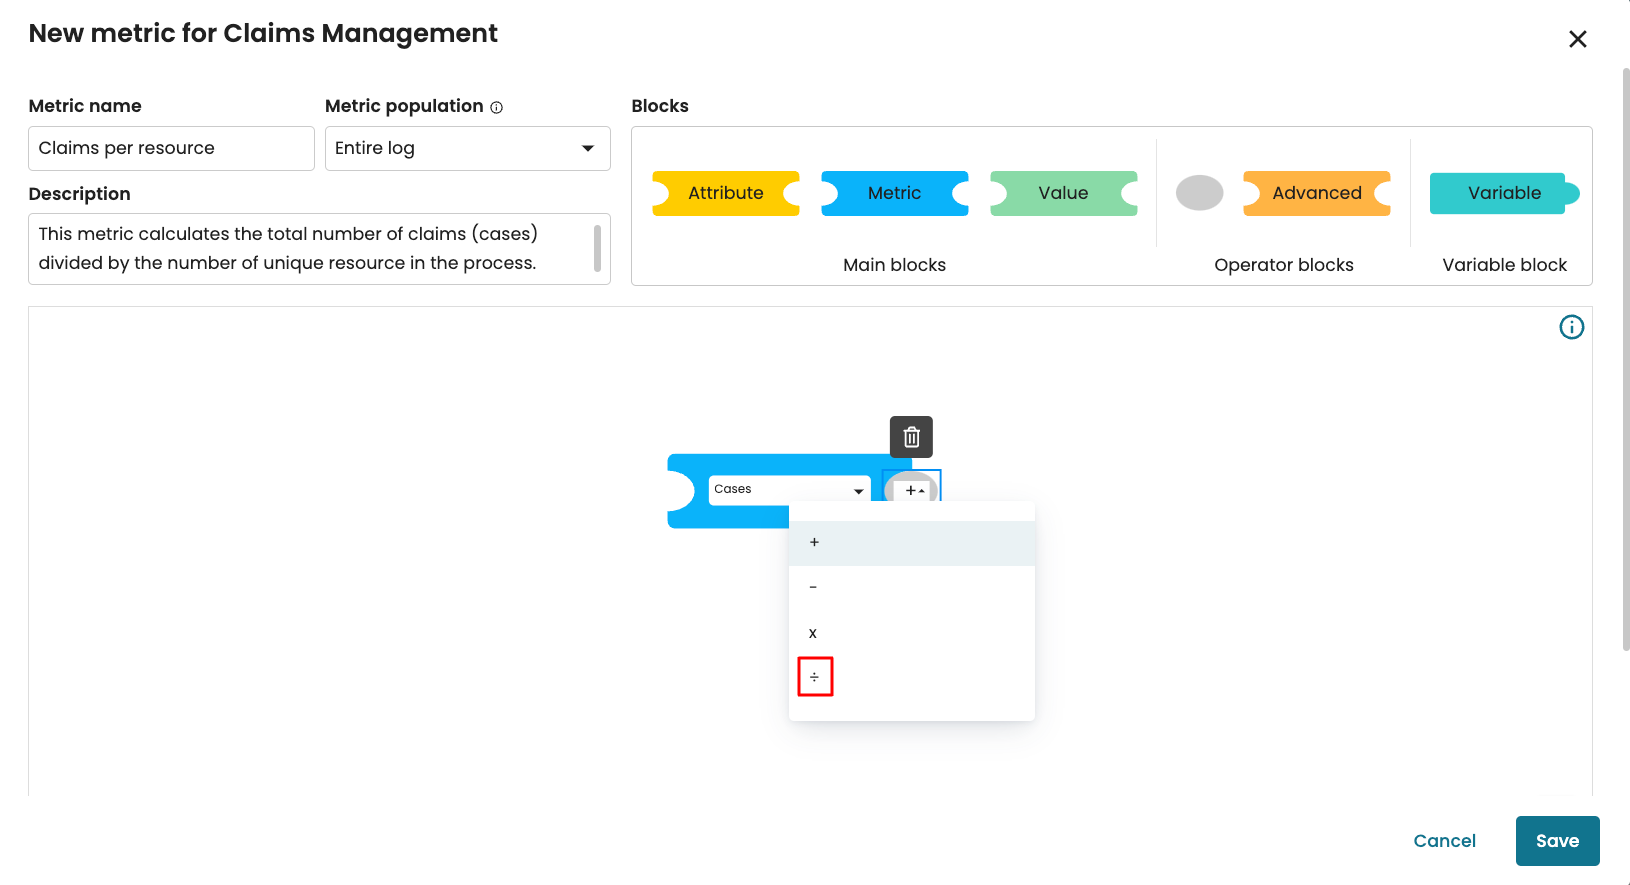
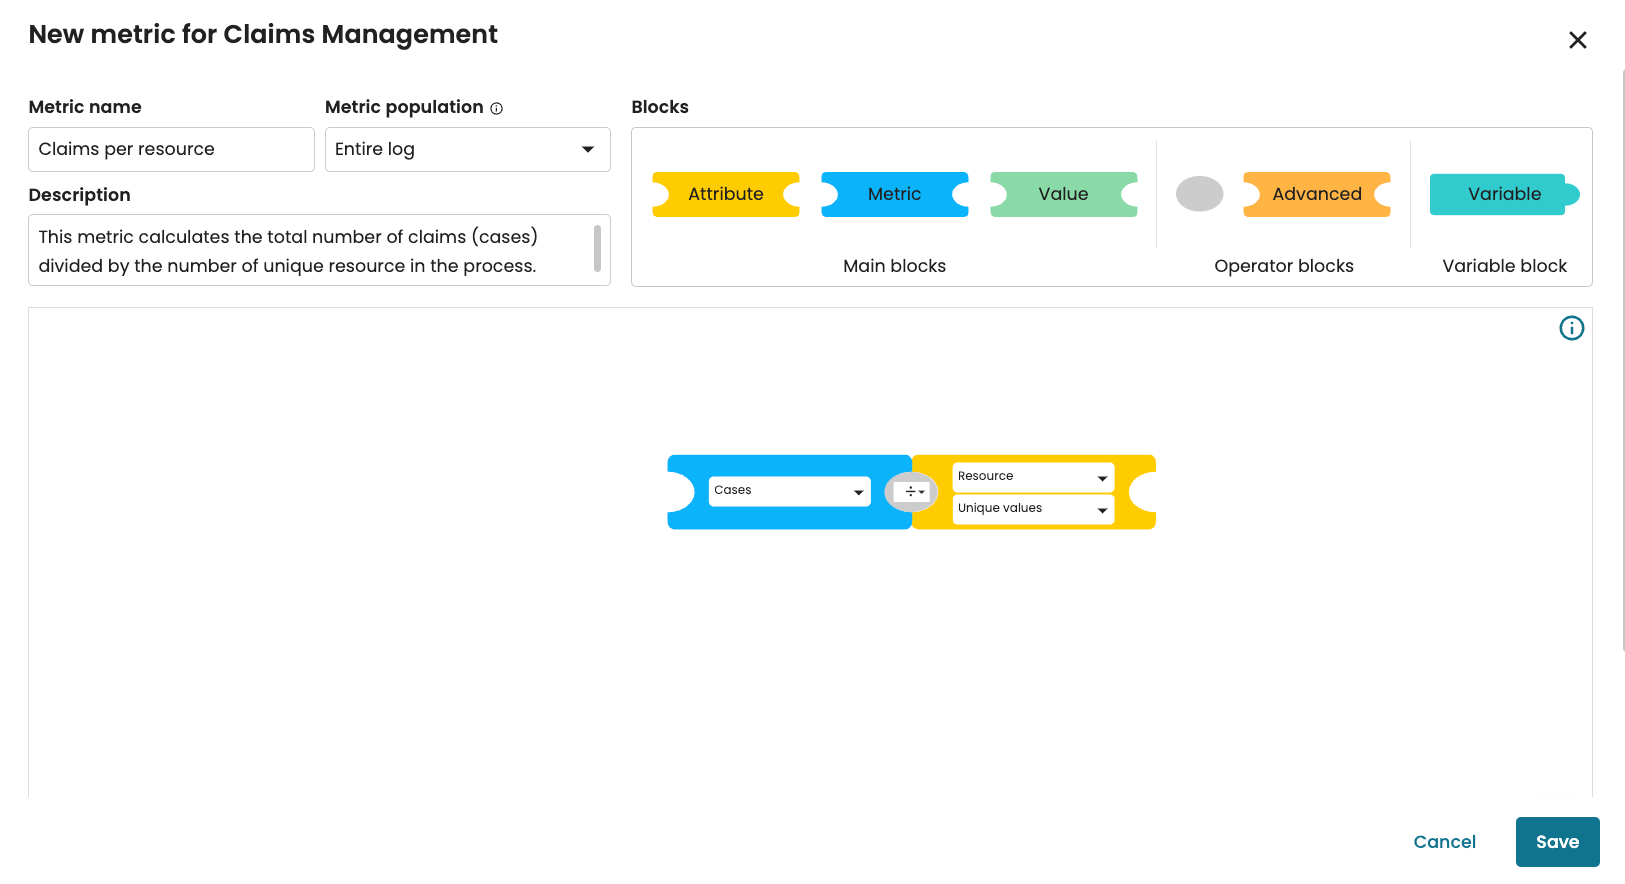
In our case, we want to divide the total number of cases by the total number of unique resources. Since the number of cases is a metric, we drag the metric block and select Cases.
Drag the mathematical operator block and select ÷.
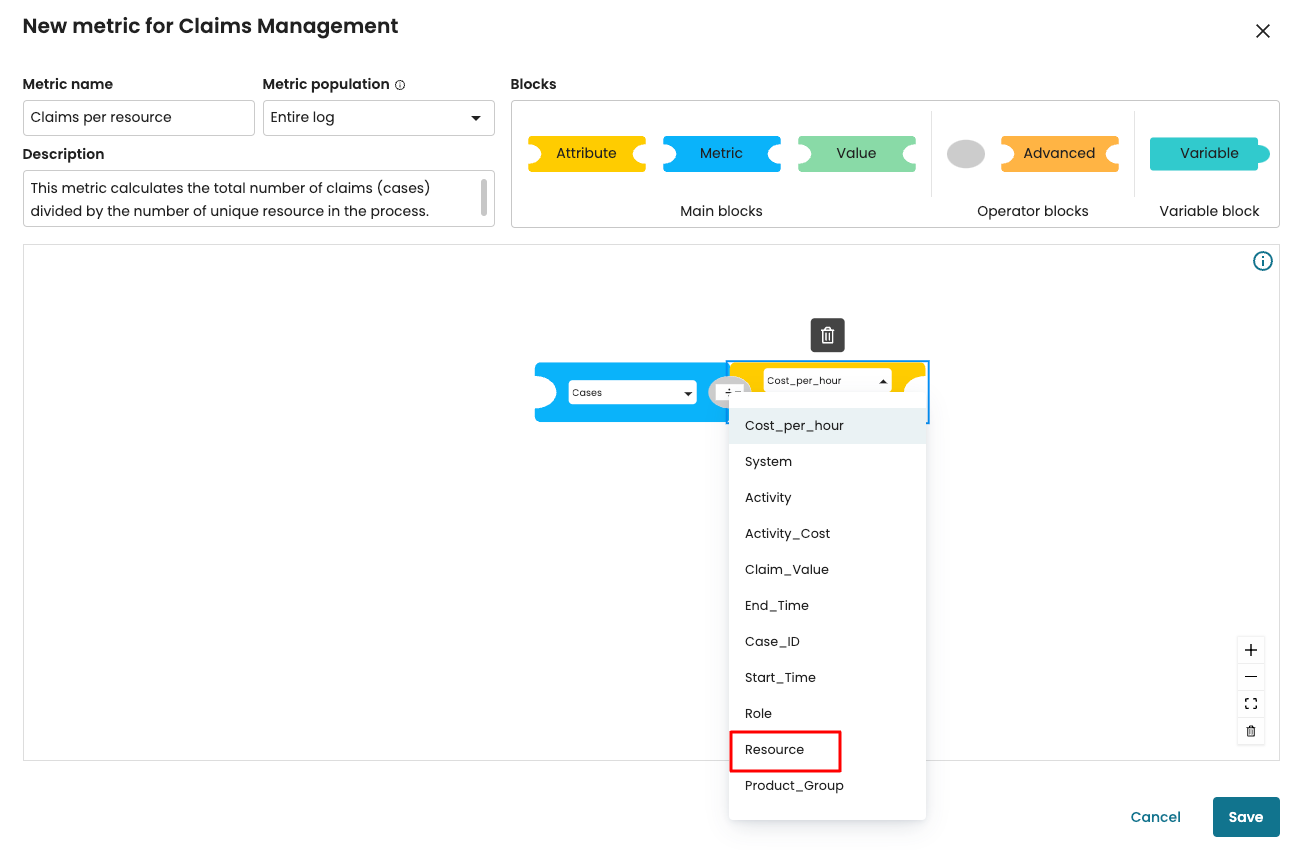
Since the resource is an event attribute, drag the attribute block and select Resource.
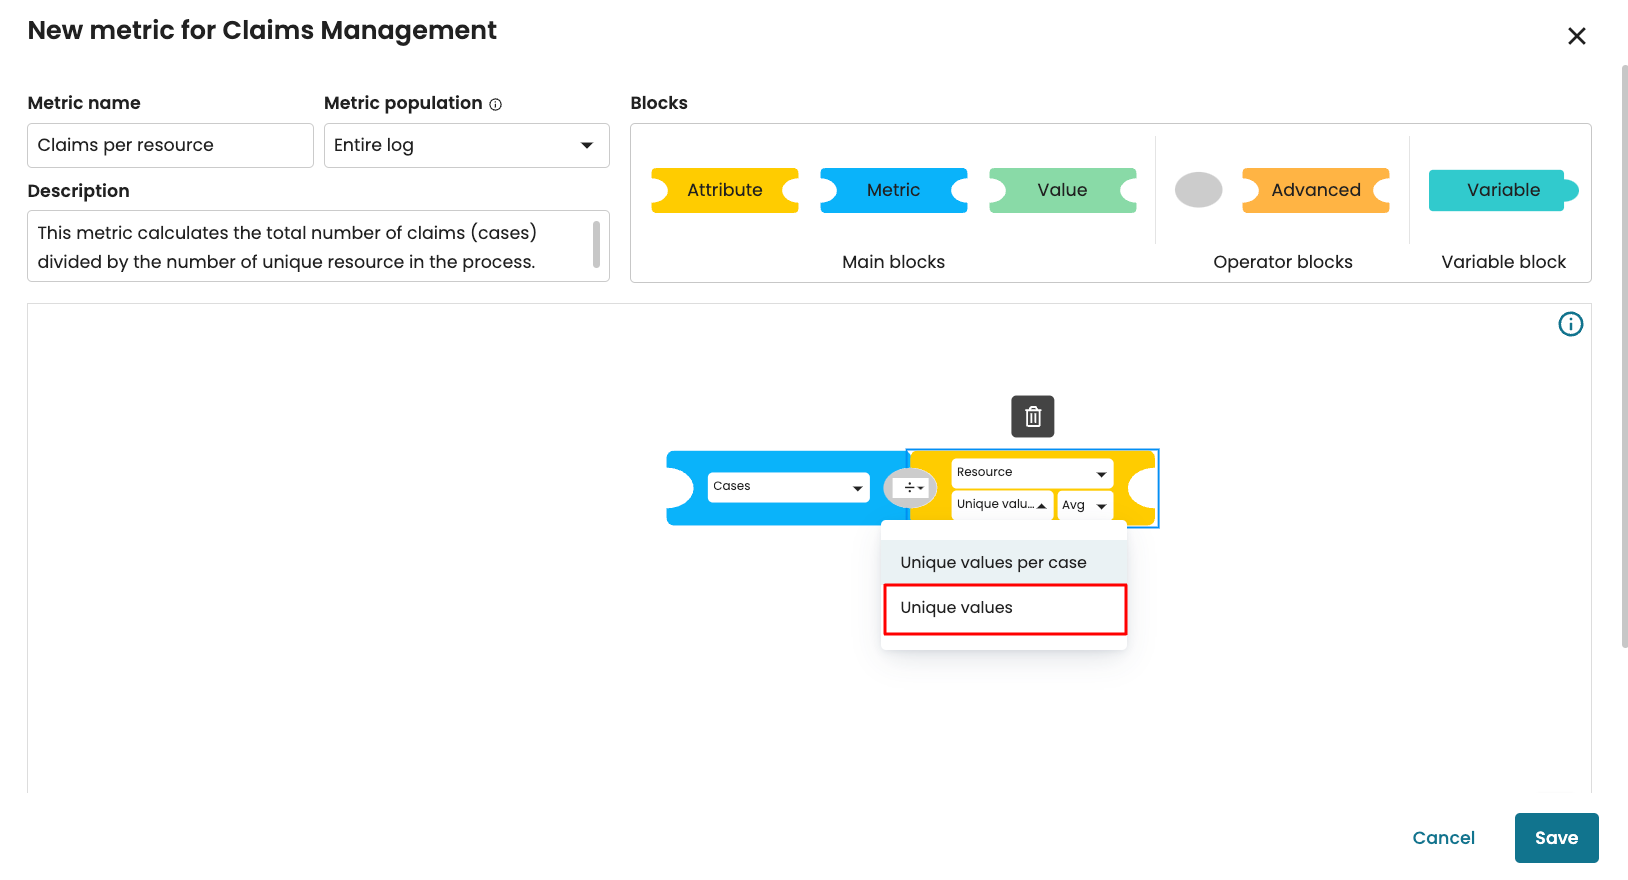
When we select an attribute with text, we can either aggregate the unique values in a case (Unique values per case) or the unique values in the entire log (Total unique values). In our case, we select Total unique values.
Note
If we select “Unique values per case”, we need to specify an aggregation function such as minimum, median, average, or maximum. If we select “Total unique values”, we do not need to specify an aggregation function. Apromore counts the number of unique values in the event log.
Click Save to save the metric on the log.
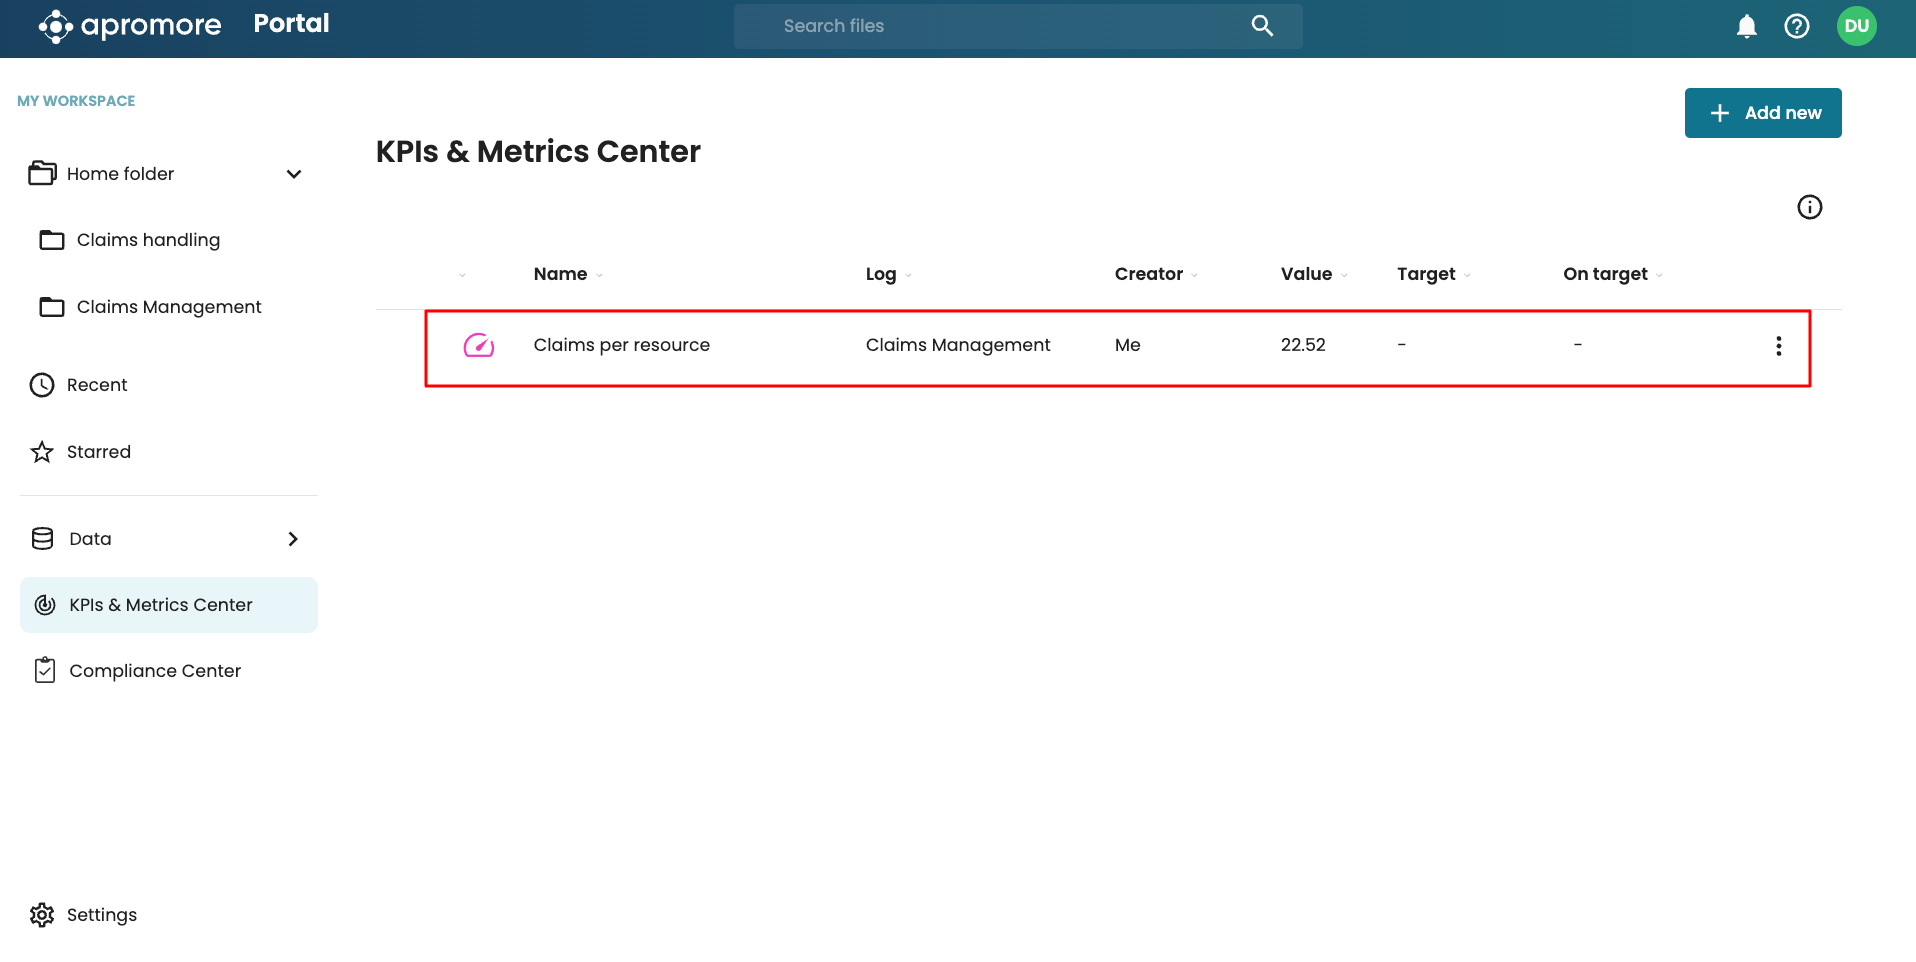
We see the metric information in the KPIs & Metrics Center.
This created metric can then be used to create KPIs. Once the KPI is defined, we will see the KPI target and see whether the metric meets this target. We can also visualize the result of the metric as a tile in a dashboard.
Note
To use a metric in a dashboard, the dashboard must be created on the same log where the metric was defined.
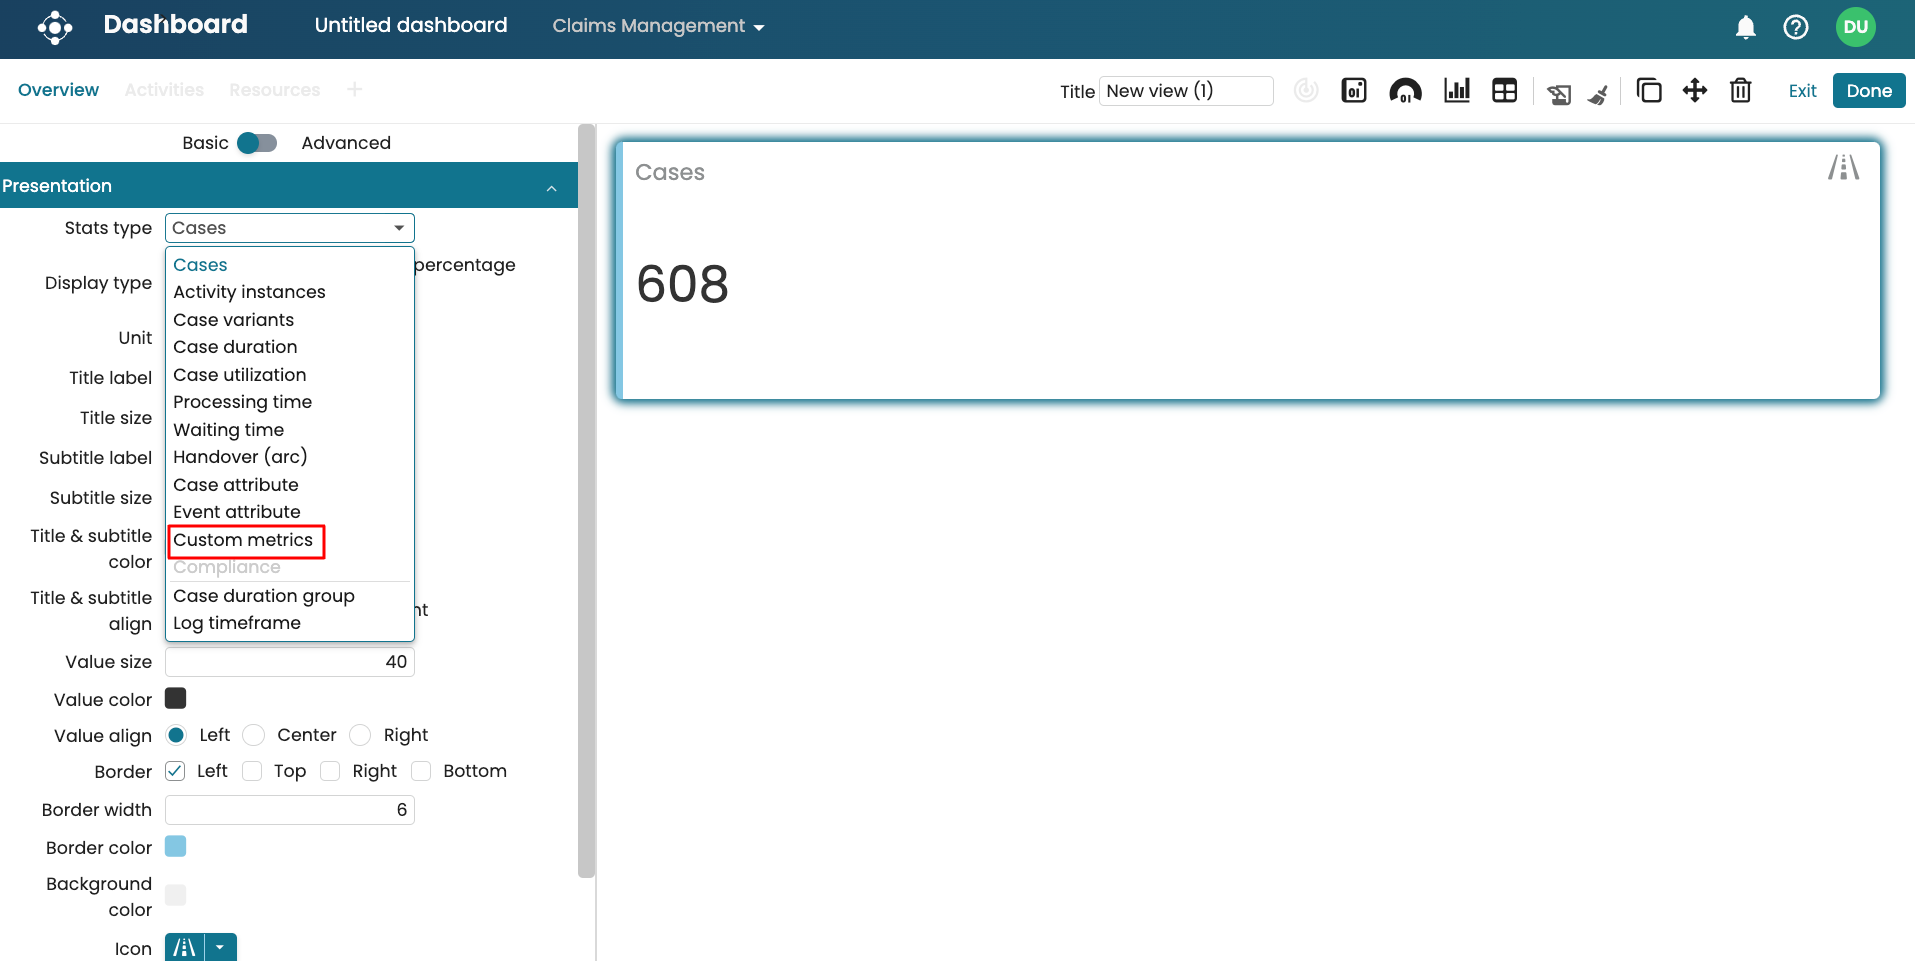
Let us create a title in a dashboard. In Stats type, select Custom metrics.
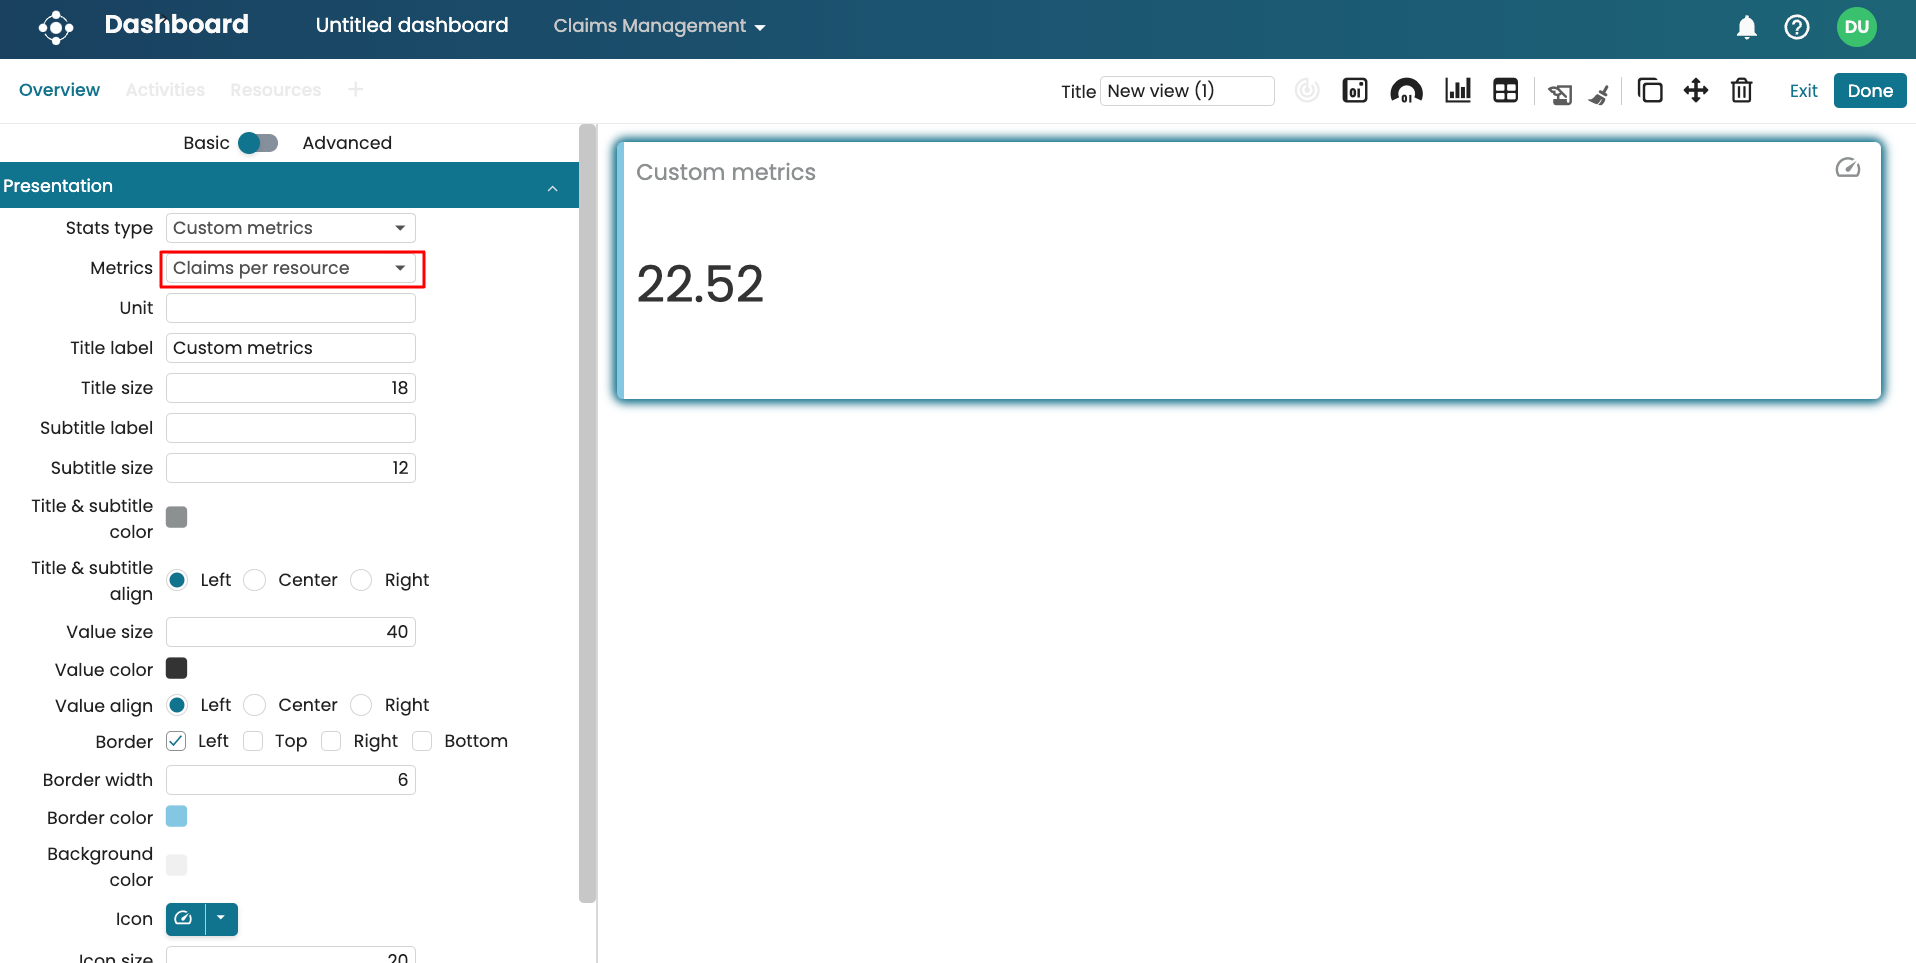
In the Metrics dropdown, select the metrics to display.
