Use predictions in dashboards and filters
Once a predictive model has been attached to an event log, we can use the two attributes associated to this prediction (the predicted value and the confidence level) in a dashboard and in filters.
Note
To learn how to attach a predictive model to an event log, see View predictions.
Use predicted attributes in dashboards
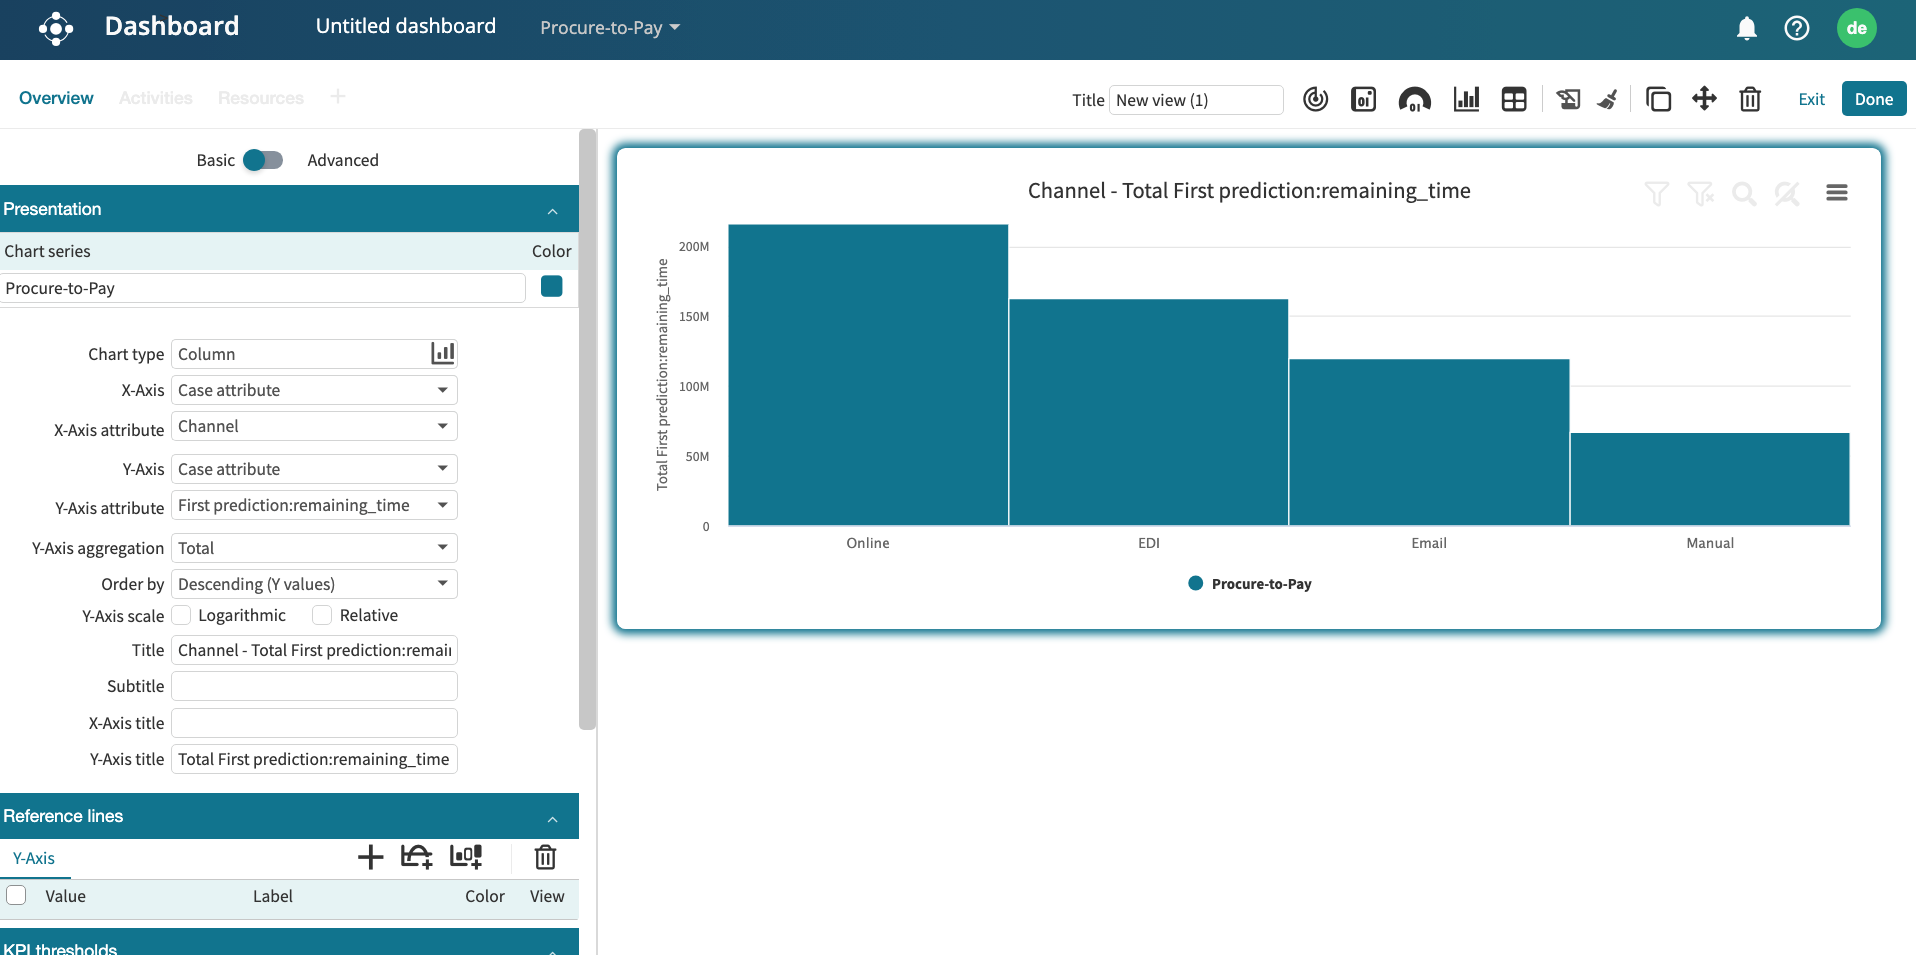
After attaching a predictor to an event log, we can use the predicted attributes in the Dashboard. Below, we show how to configure a chart to display, for each channel, the predicted remaining time.
Select Case attribute on the X-Axis. Select “Channel” as the X-Axis Attribute. Select “Case attribute” as the Y-Axis and select “P2P_remaining_time:remaining_time” as the Y-Axis Attribute.
In this example, we select Column as the Chart type.
Use predicted attributes in filters
We can also use the predicted attributes to filter an event log. For instance, we can filter cases where “predicted remaining time” is greater than a given value
To do this, open an event log with Process Discoverer and create a filter. In the Case attribute tab, select “P2P_remaining_time:remaining_time” from the dropdown.
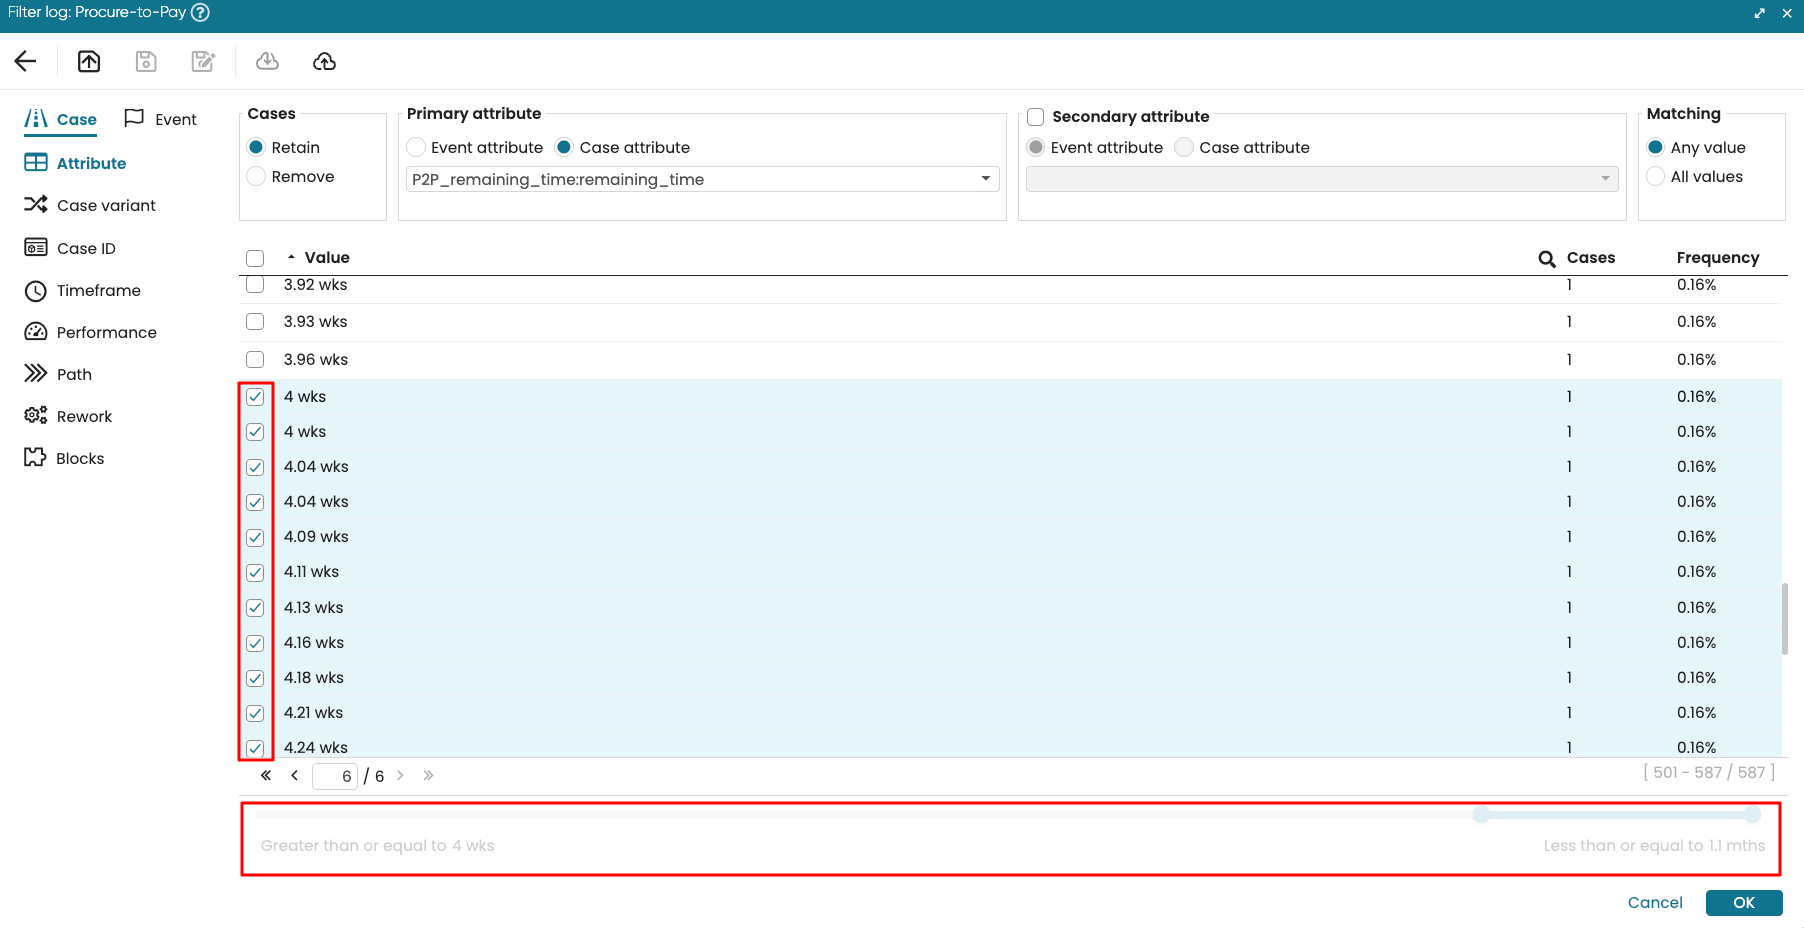
This will enable us to filter the log based on the values in the “predicted remaining time” attribute.