Additional dashboard functionality
Edit dashboard
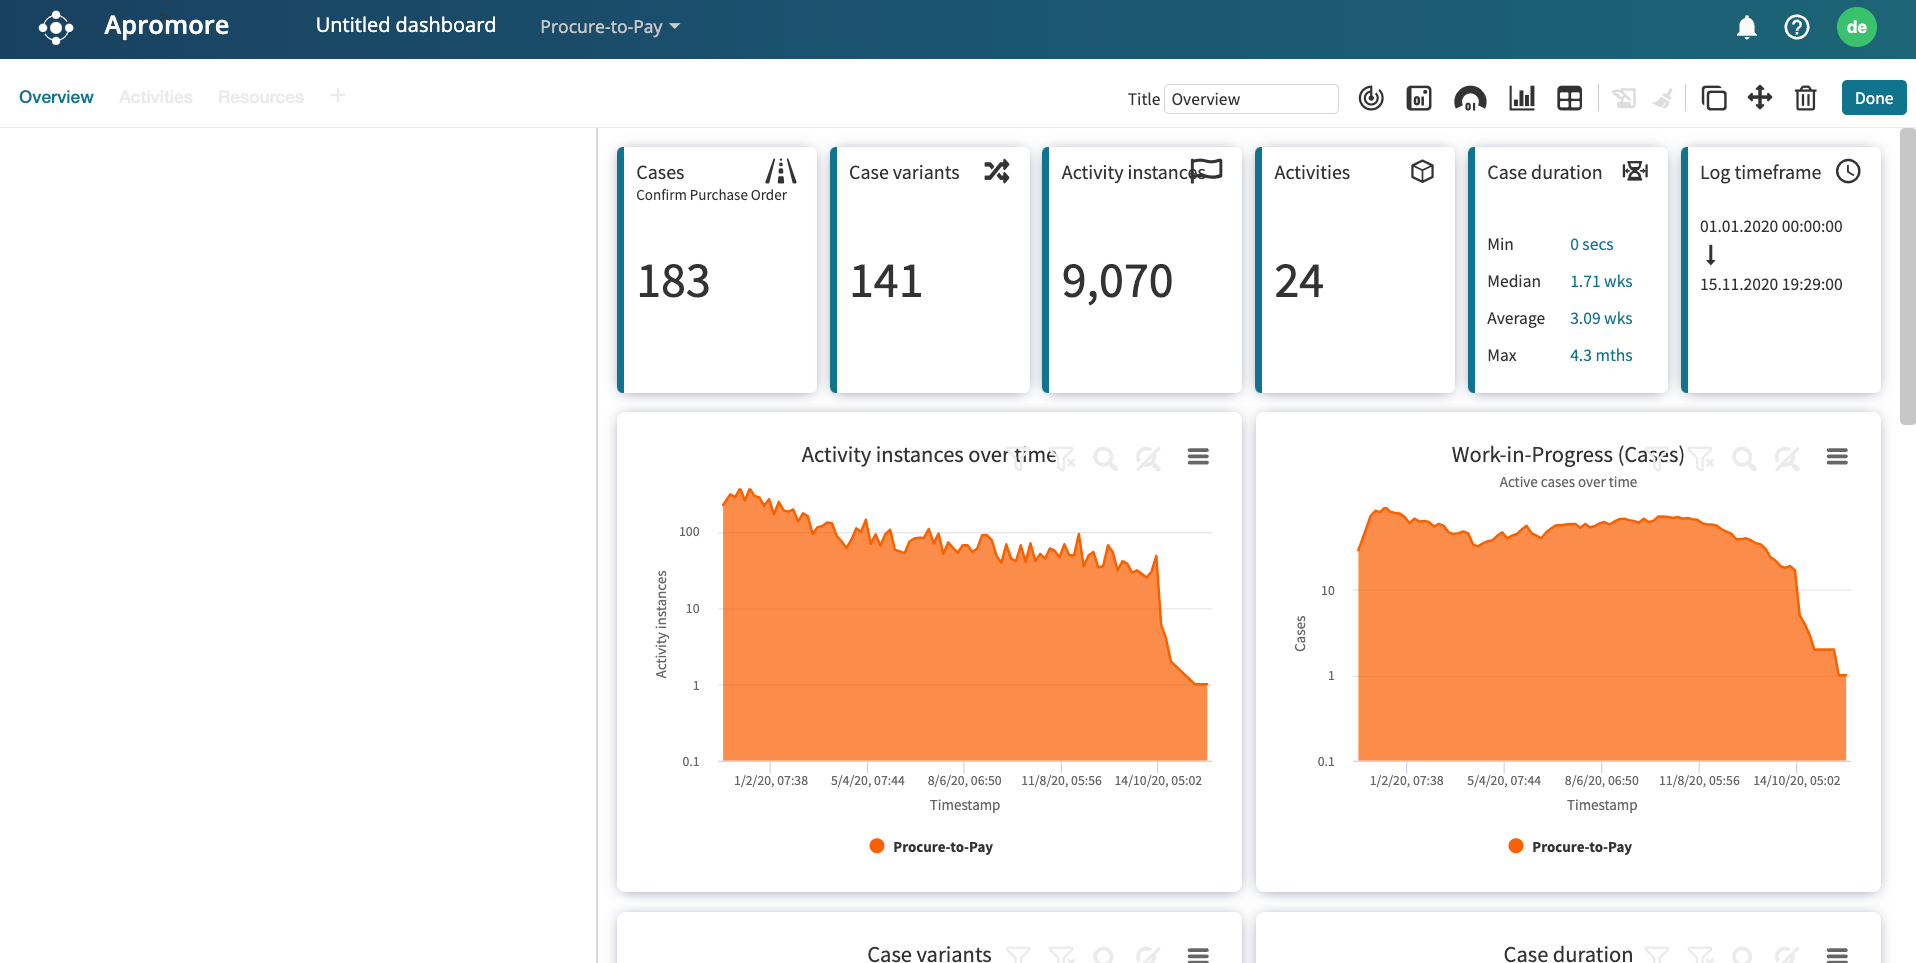
To edit the new dashboard, click on the  button.

Advanced view – slice & filter
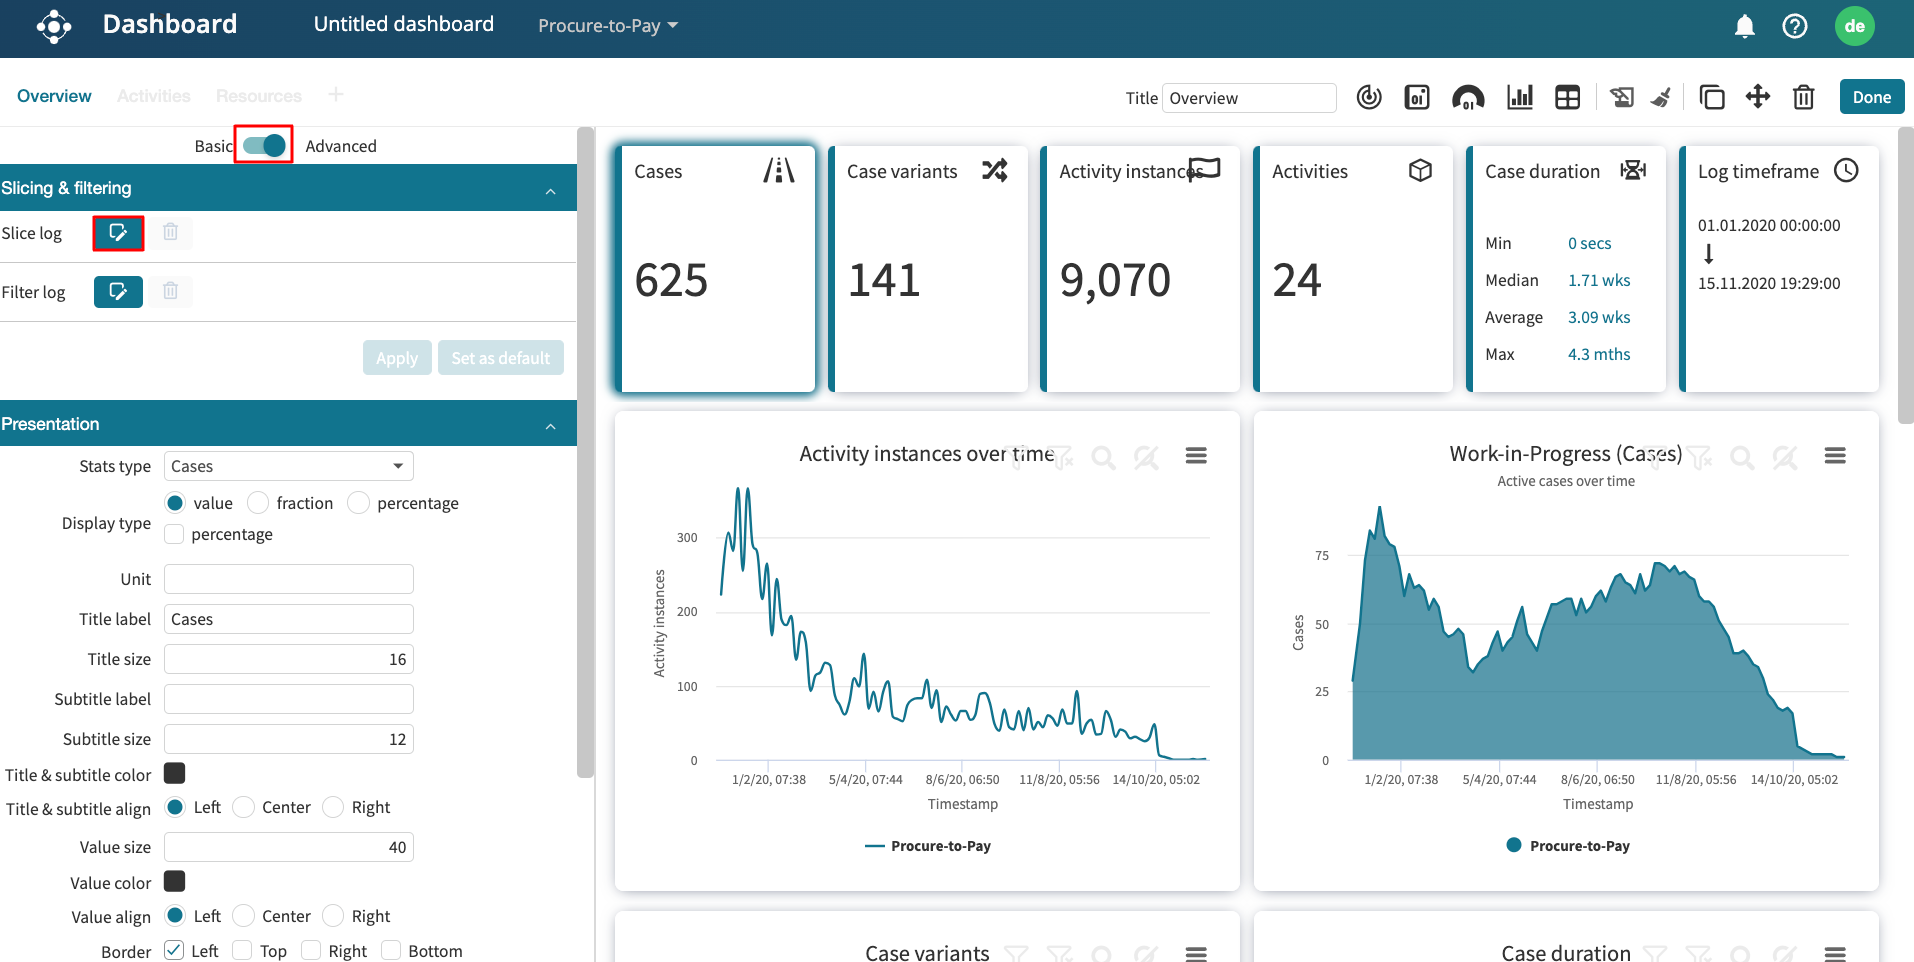
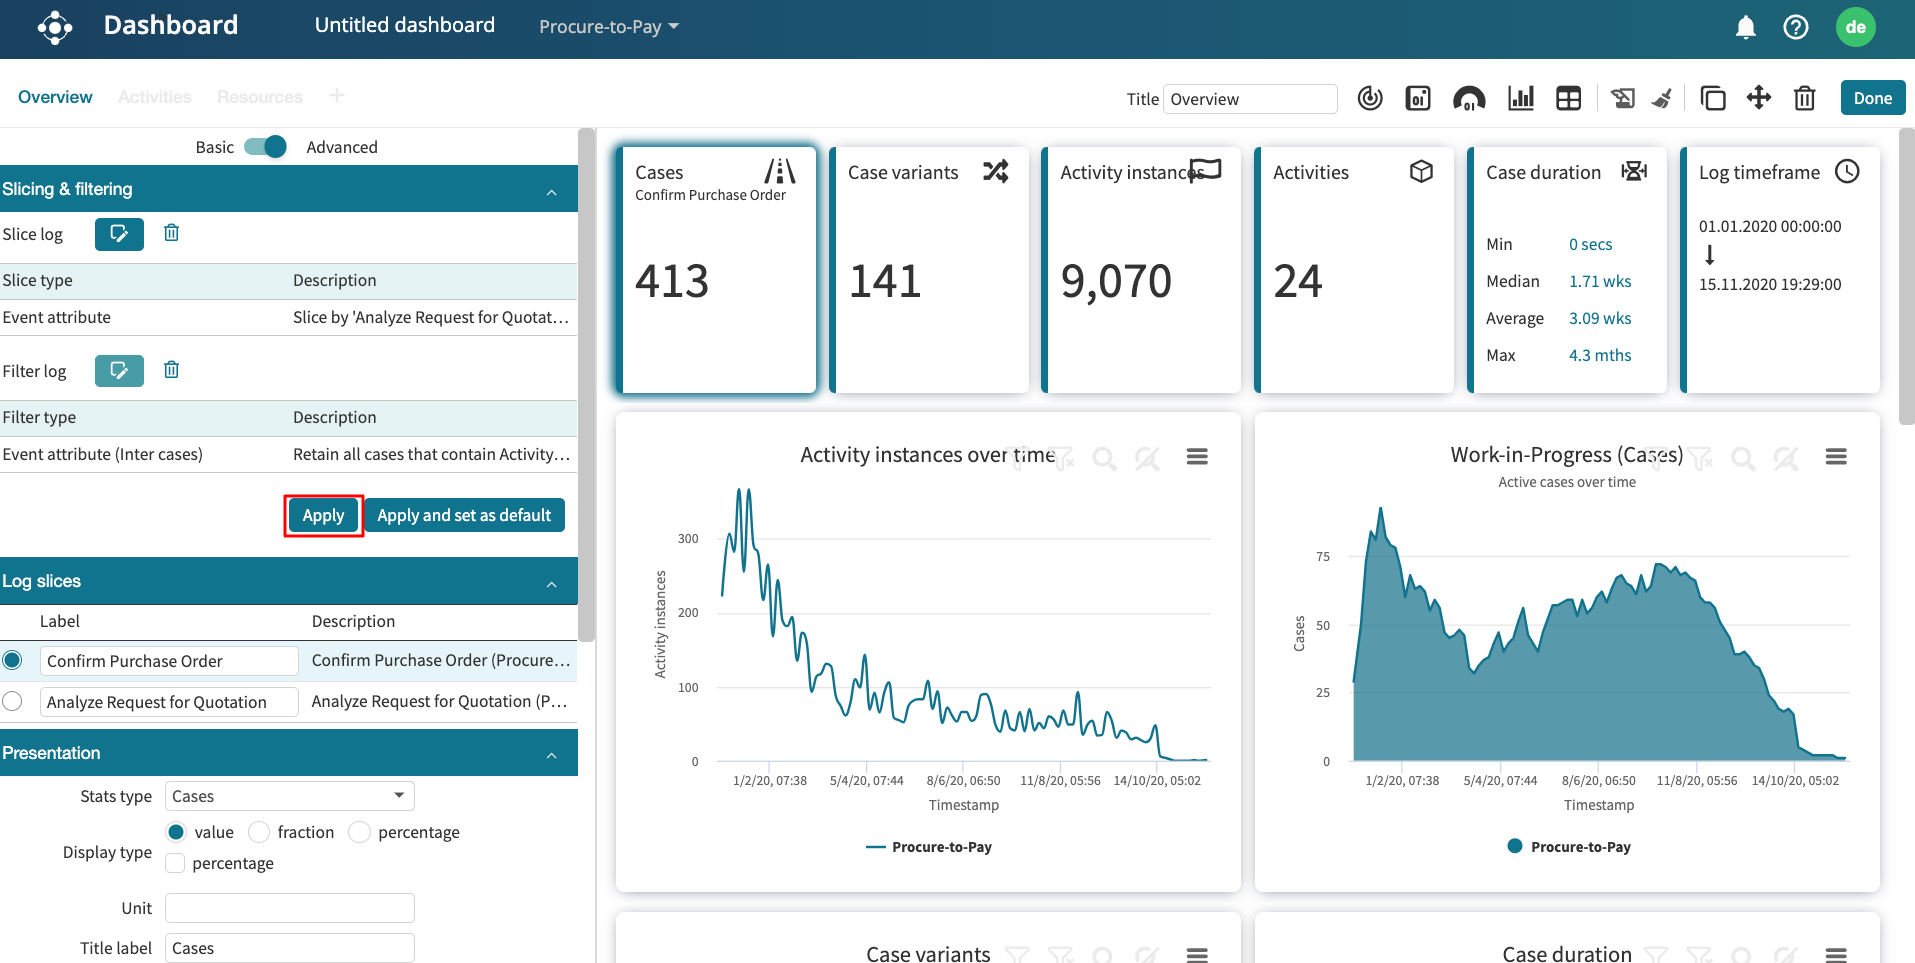
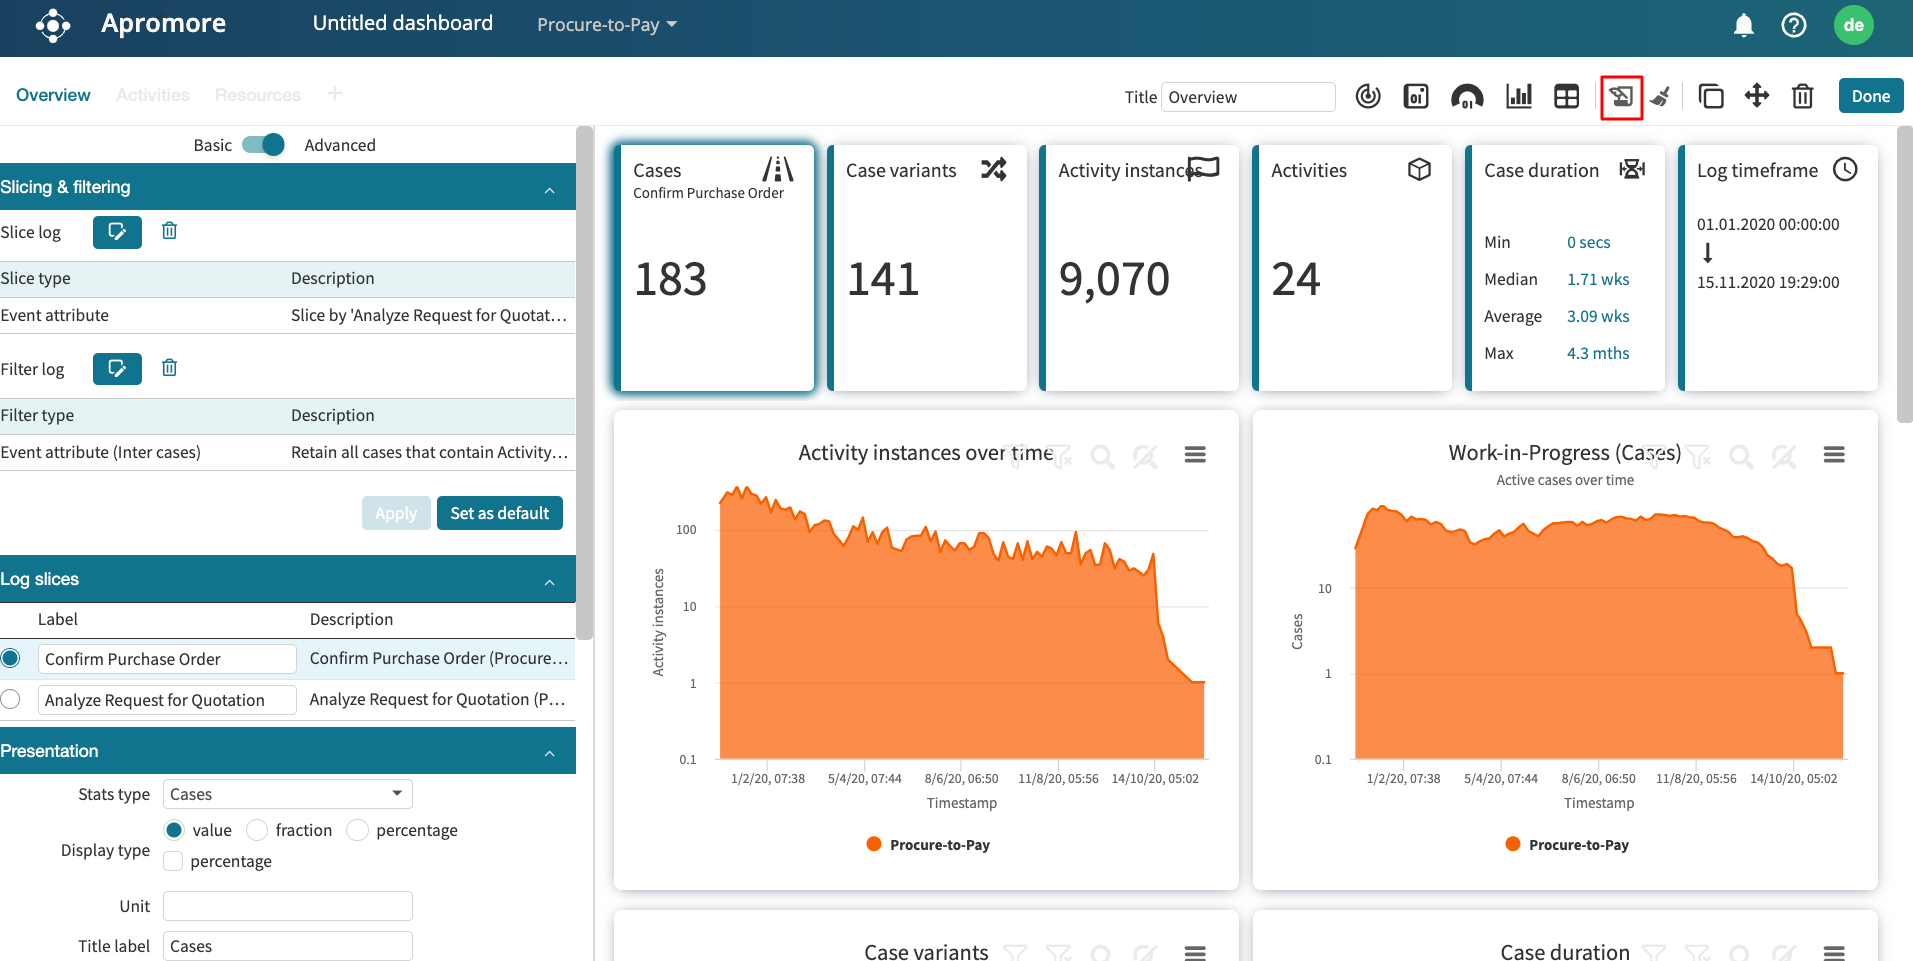
The Advanced view allows us to slice and filter the logs.
To slice a log, switch to the Advanced view and click the  button next to the Slice Log.
Advanced > slice
We can slice a log based on Event attribute, Case attribute, Timeframe, or Performance.
To slice a log, click the edit icon next to Slice log.
In case of Event attribute select the events with which you want to slice the log.
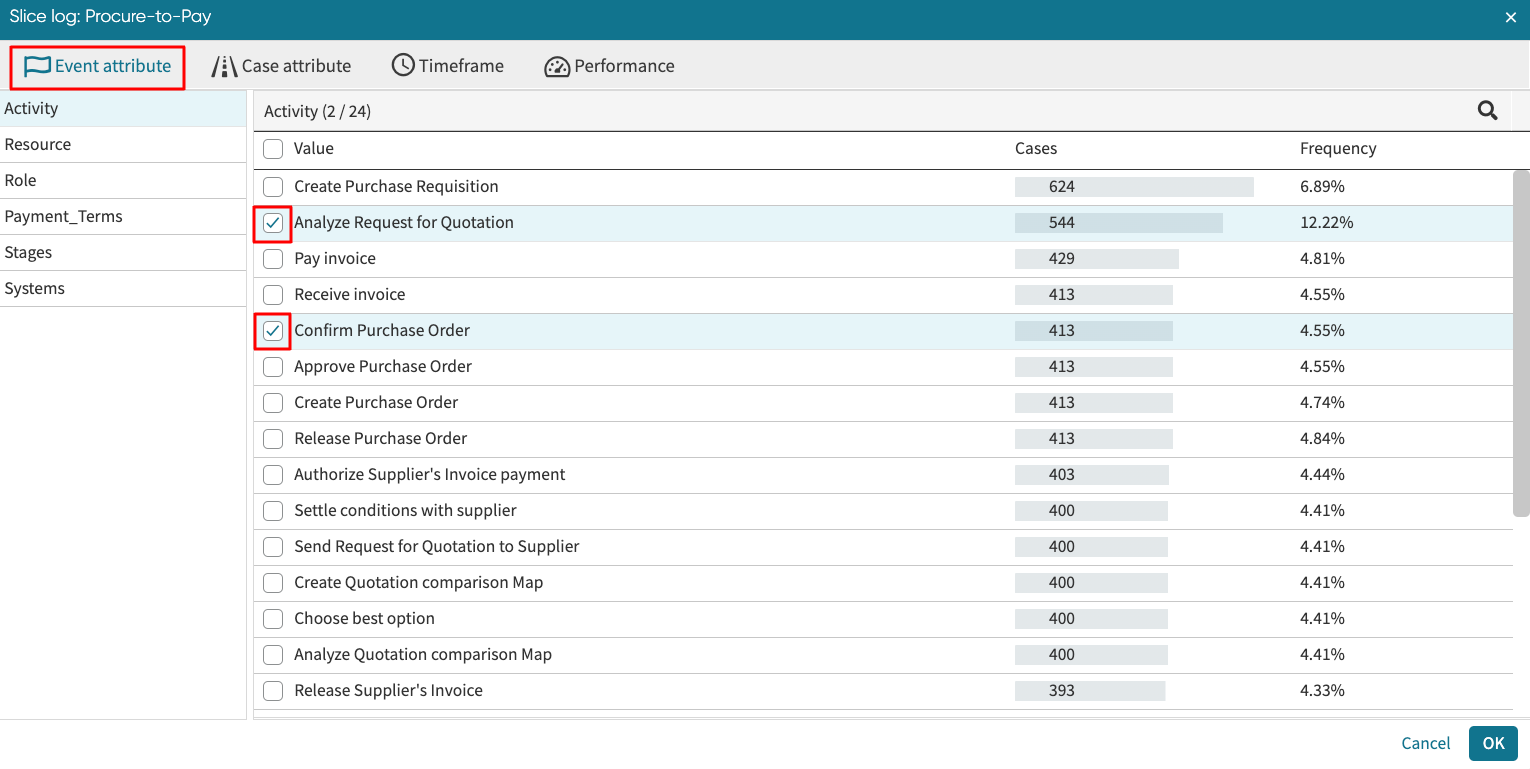
Click OK to see the result of the filter we created.
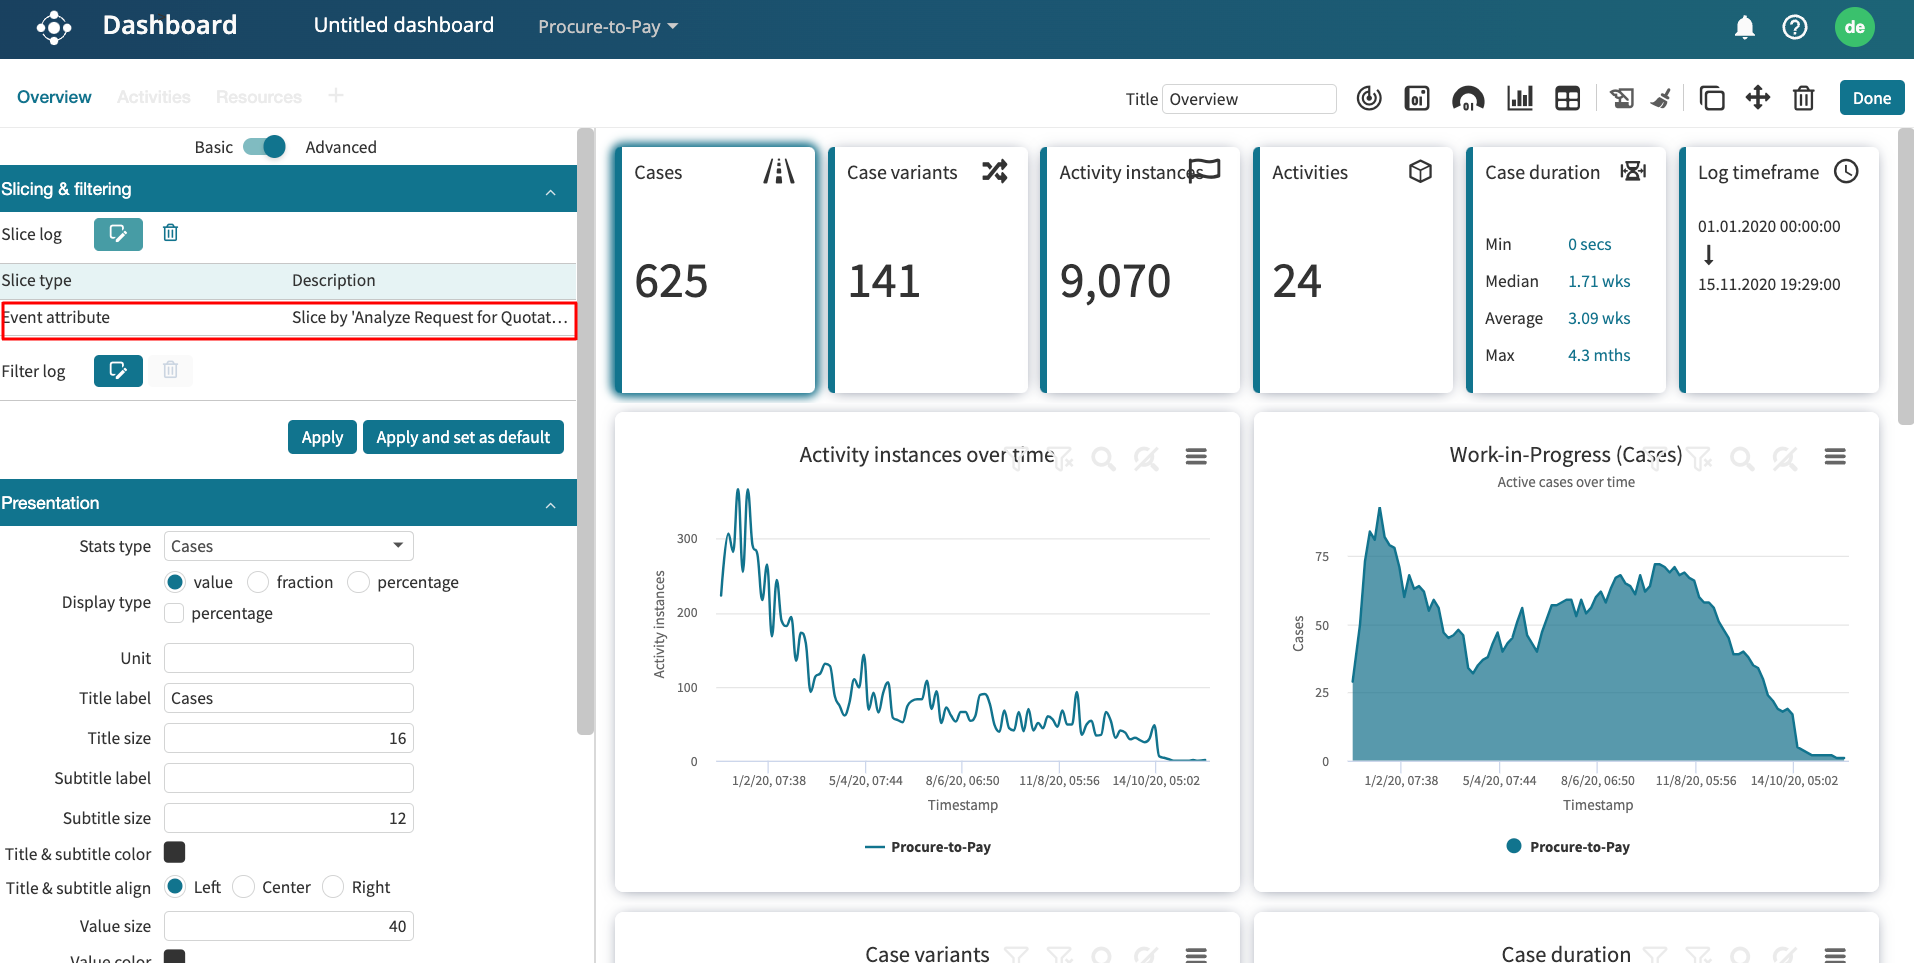
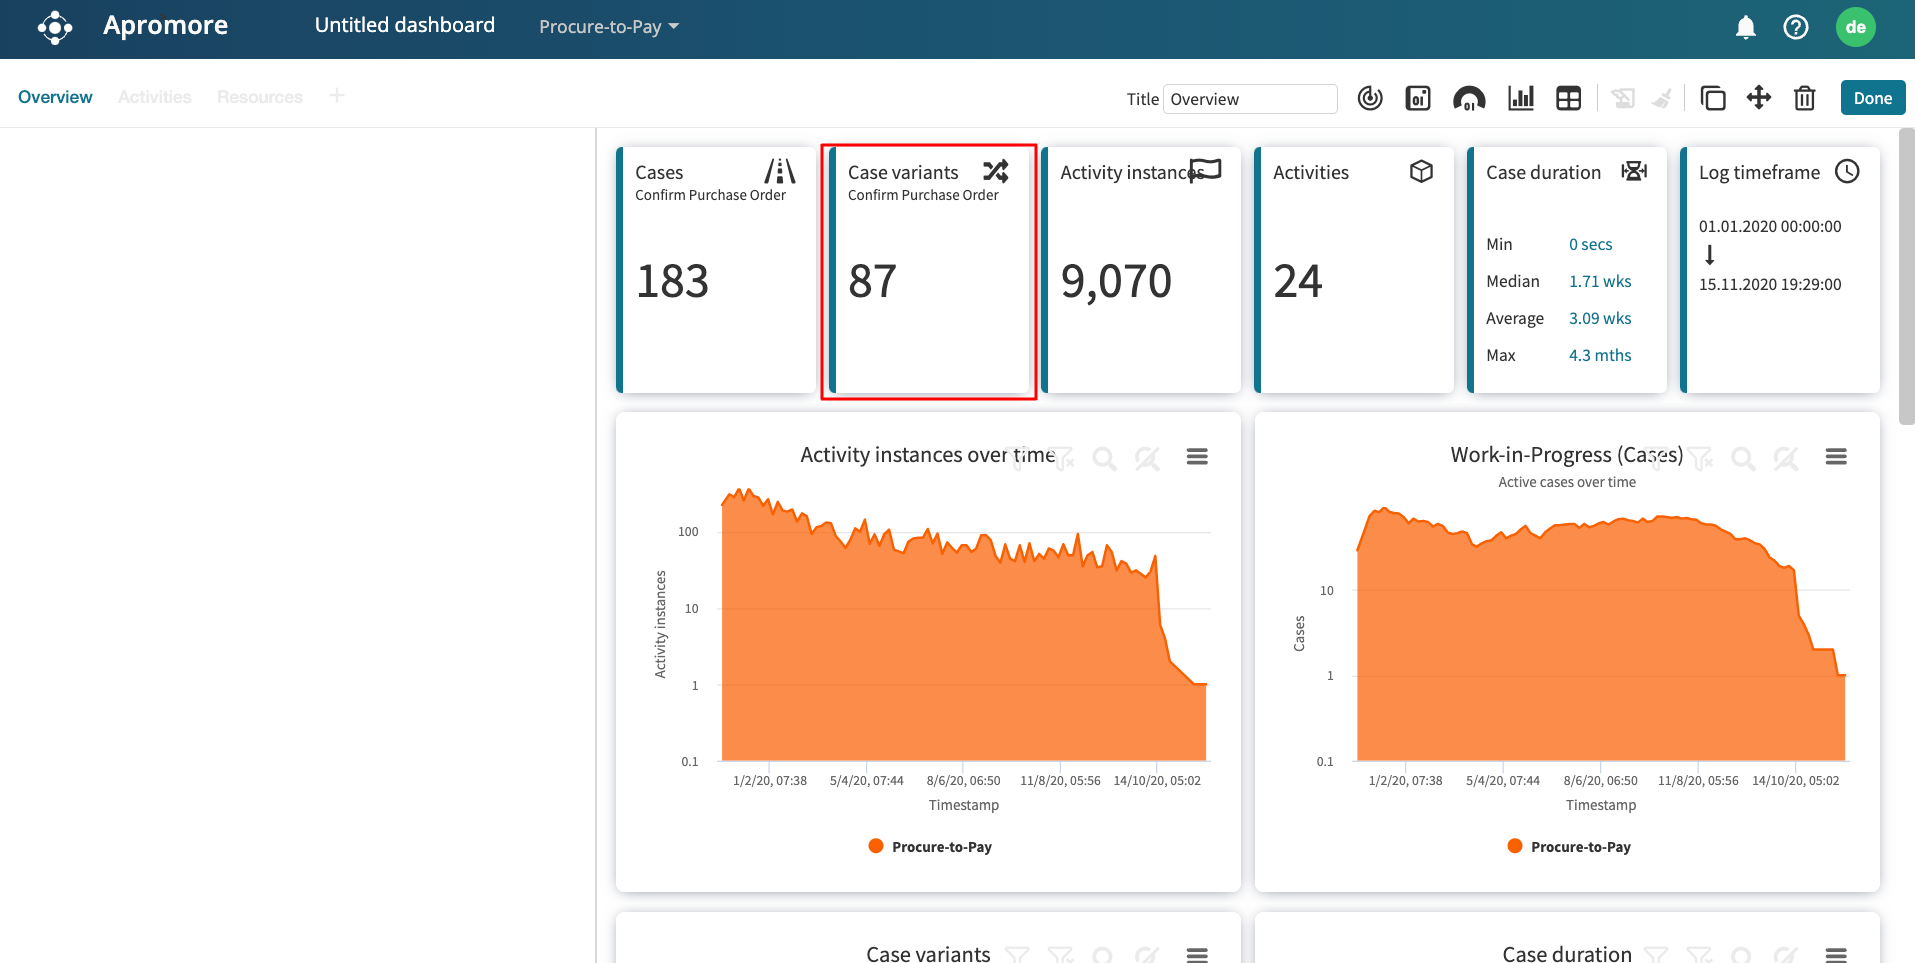
Click Apply.
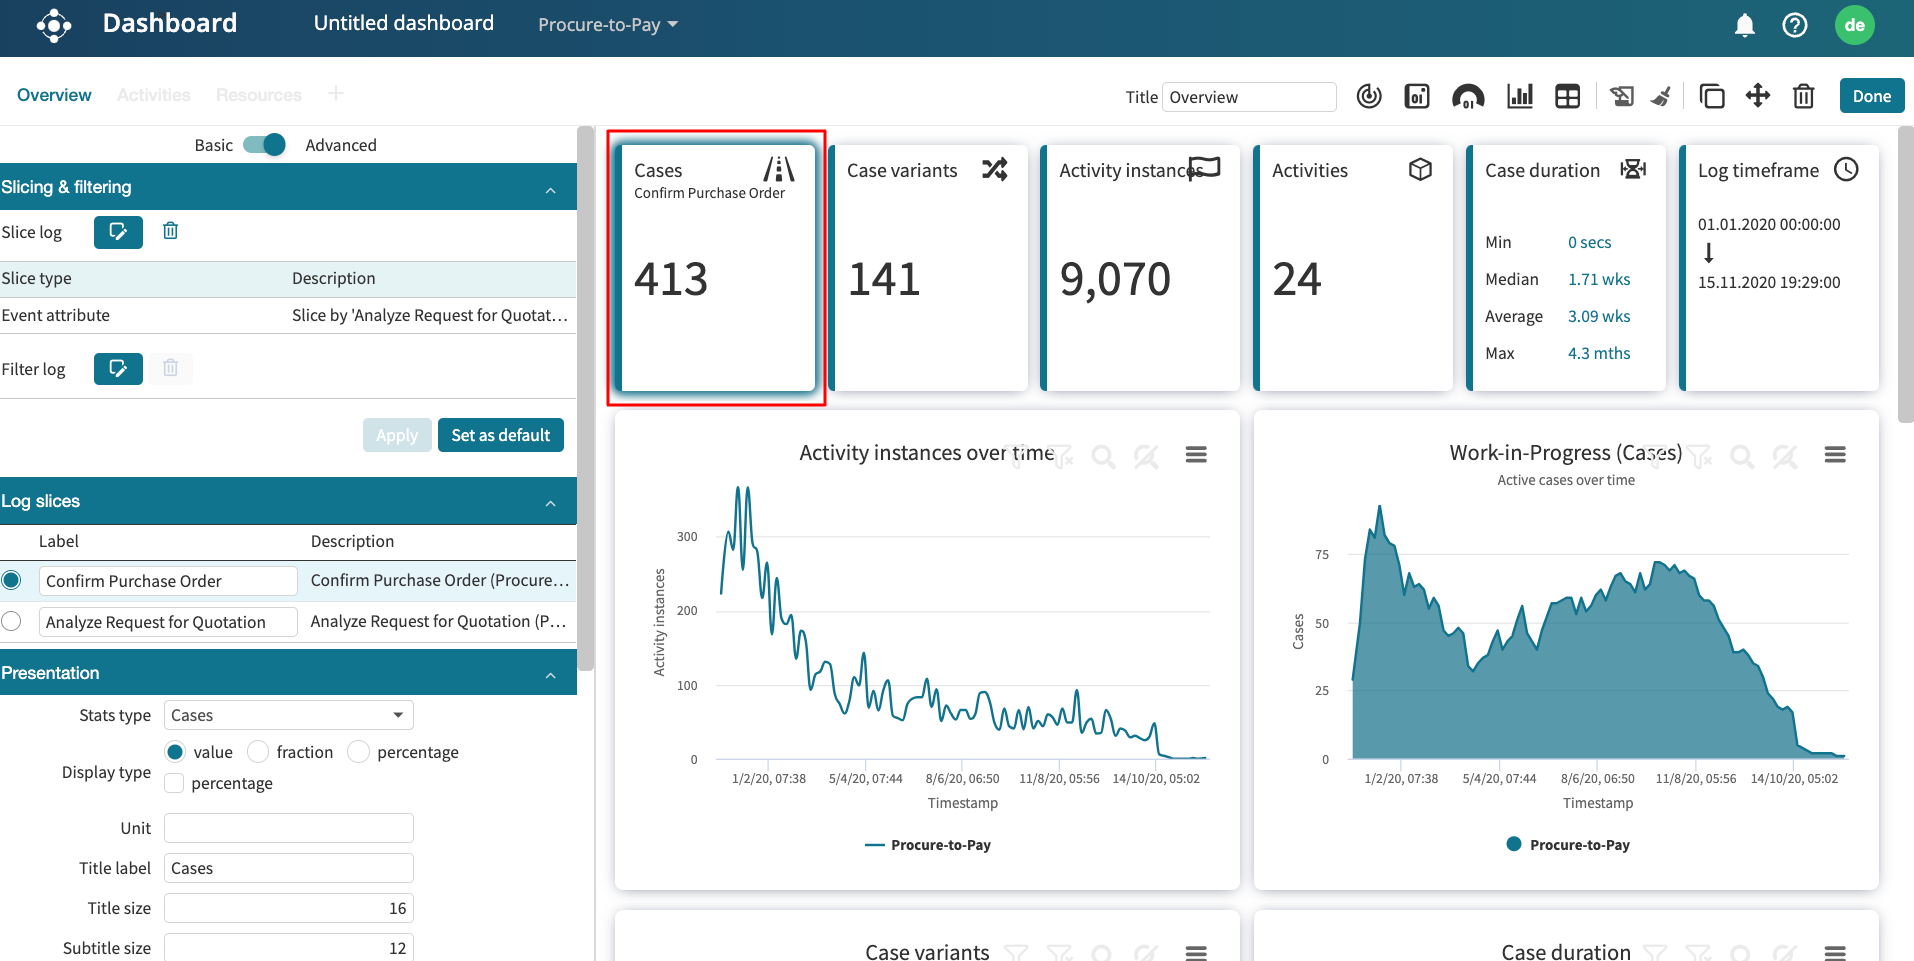
The result shows 413 cases fulfills our slice condition.
Similarly, we can slice by case attribute, performance , or timeframe.
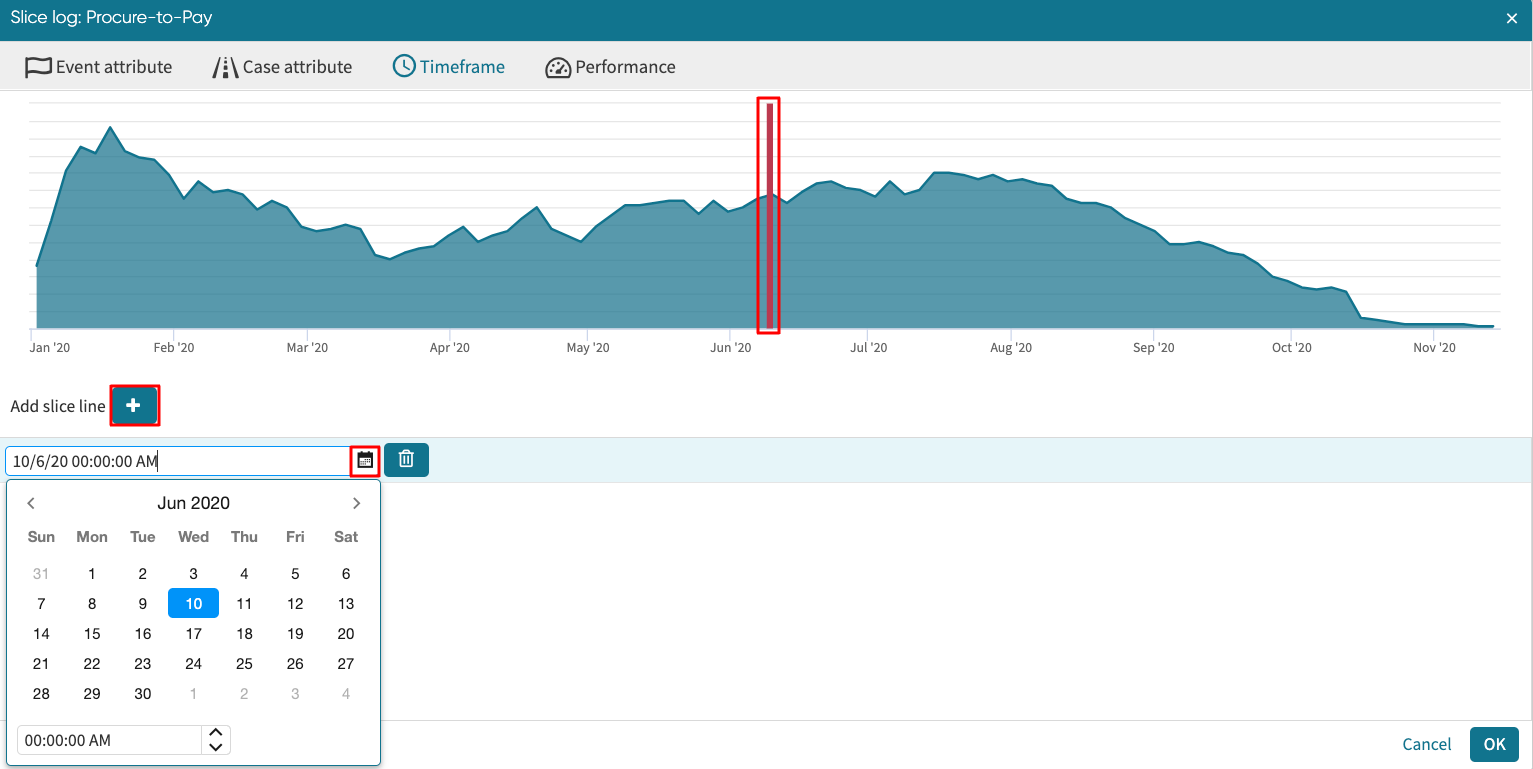
In case of Timeframe and Performance there is an option of Add slice line.
To do this, click the  button next to Add Slice Line and slide the slider.
Alternatively, you can also select a date from the date picker.
button next to Add Slice Line and slide the slider.
Alternatively, you can also select a date from the date picker.
Advanced > filter
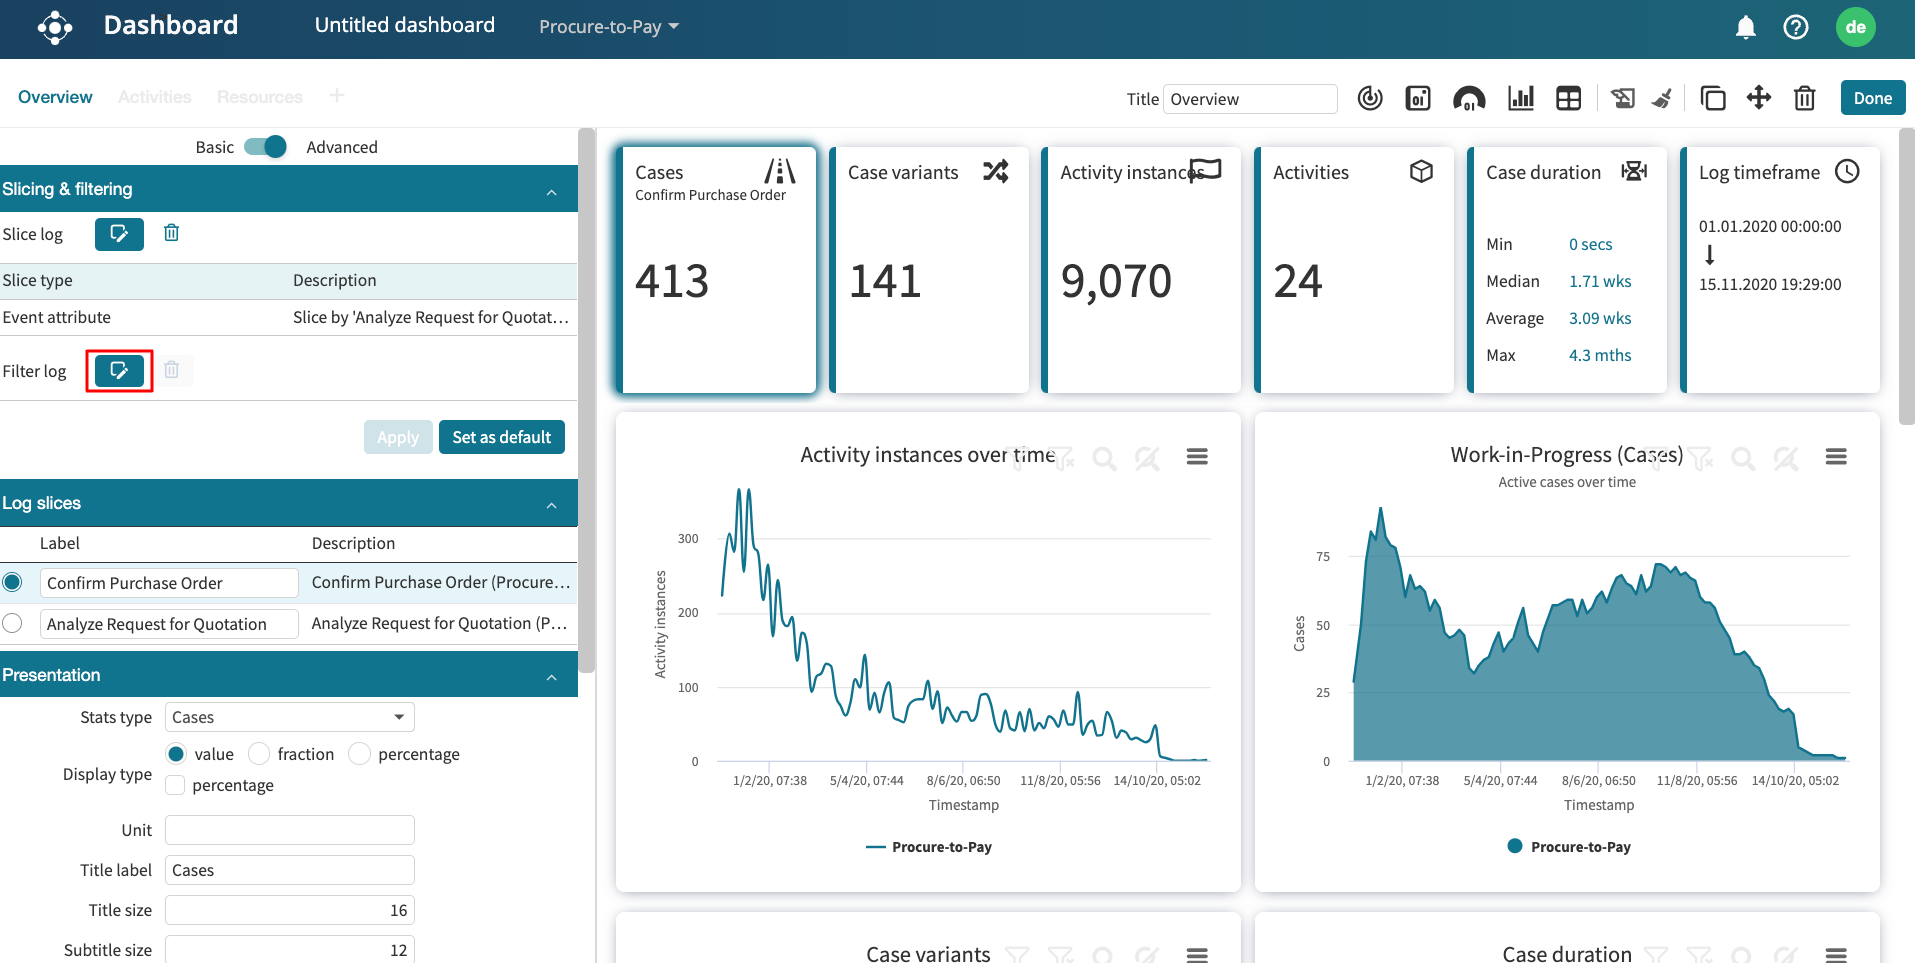
We can add a filter by clicking the Filter log button.
This opens the Filter log window where we can specify filter criteria. To learn more about creating filters, see Types of filter criteria.
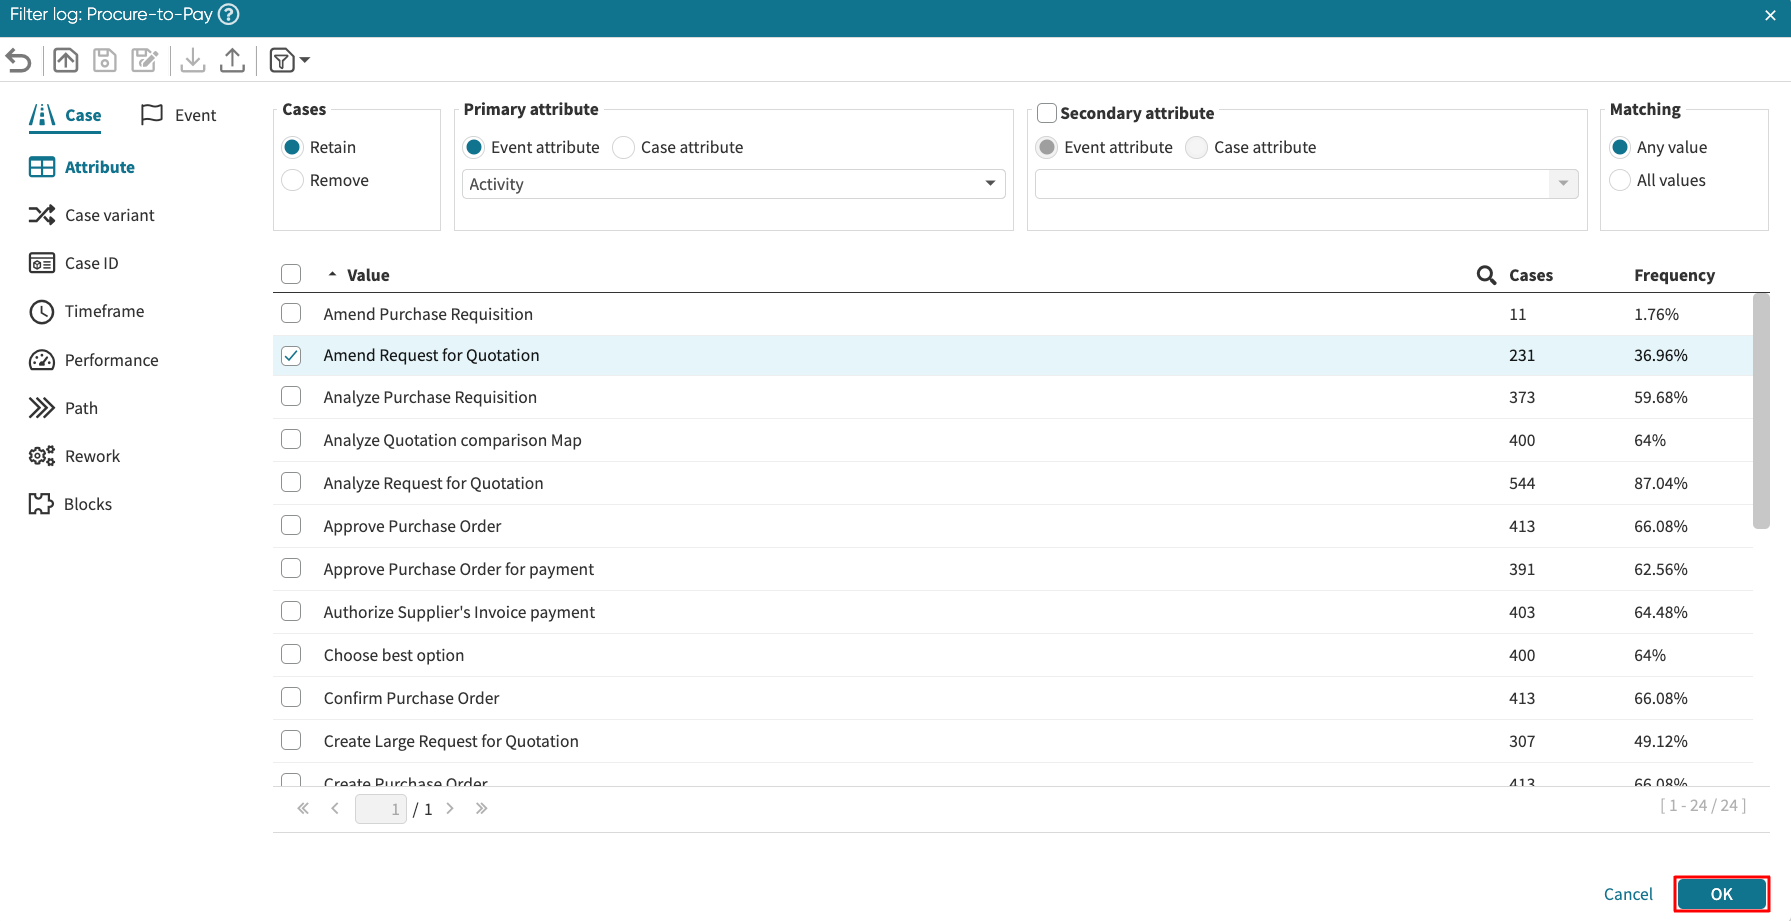
Click Apply to apply the filter.
Add reference lines
For visualization purpose, we can also add reference lines to a chart to mark important timelines. Reference lines can be either vertical (in the X-Axis tab) or horizontal (in the Y-Axis tab). To add a reference line, click + in the reference line section.

Add KPI
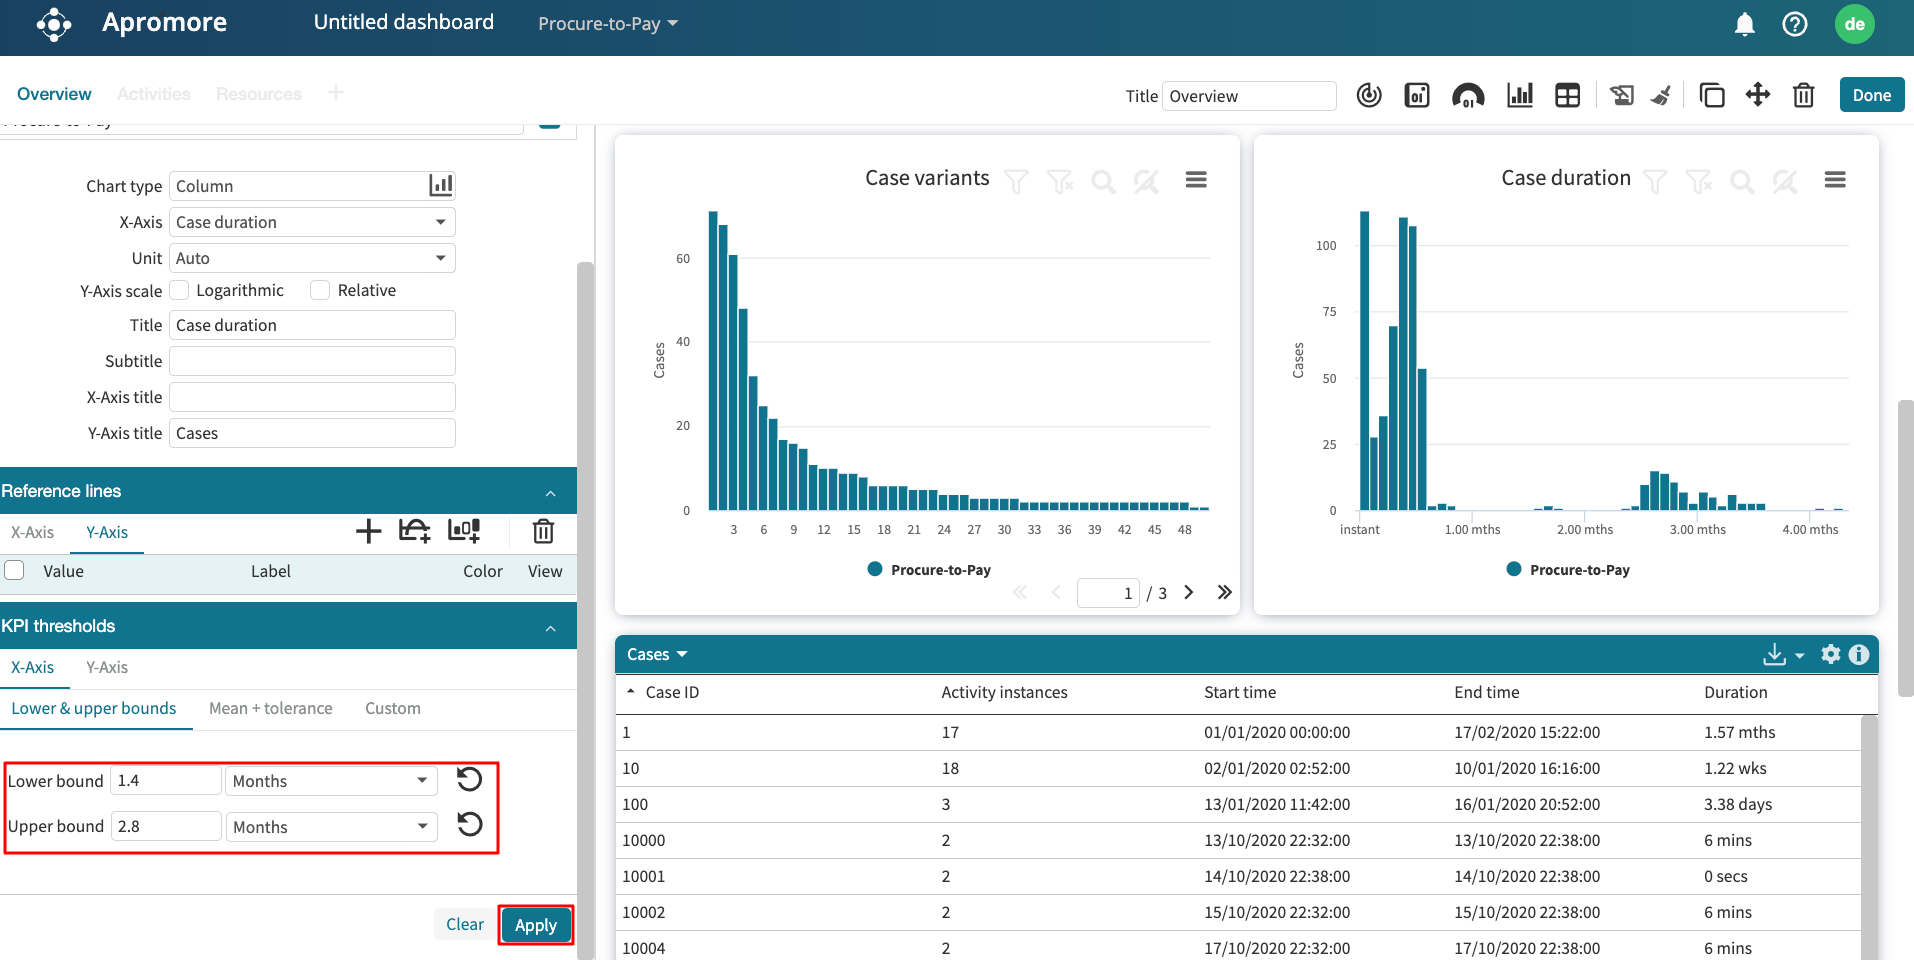
We can add a KPI target from the KPI thresholds section. We can specify a KPI using:
Lower & upper bounds
Mean + tolerance
Custom
In each section, specify the thresholds for the KPI fulfillment/violation. For instance, in the Case duration chart, we can add a KPI threshold that flags red when the duration is less than 1.4 months (lower bound), amber when it is between 1.4 to 2.8 months and red when it is greater than 2.8 months (upper bound).
After specifying the threshold, click Apply.
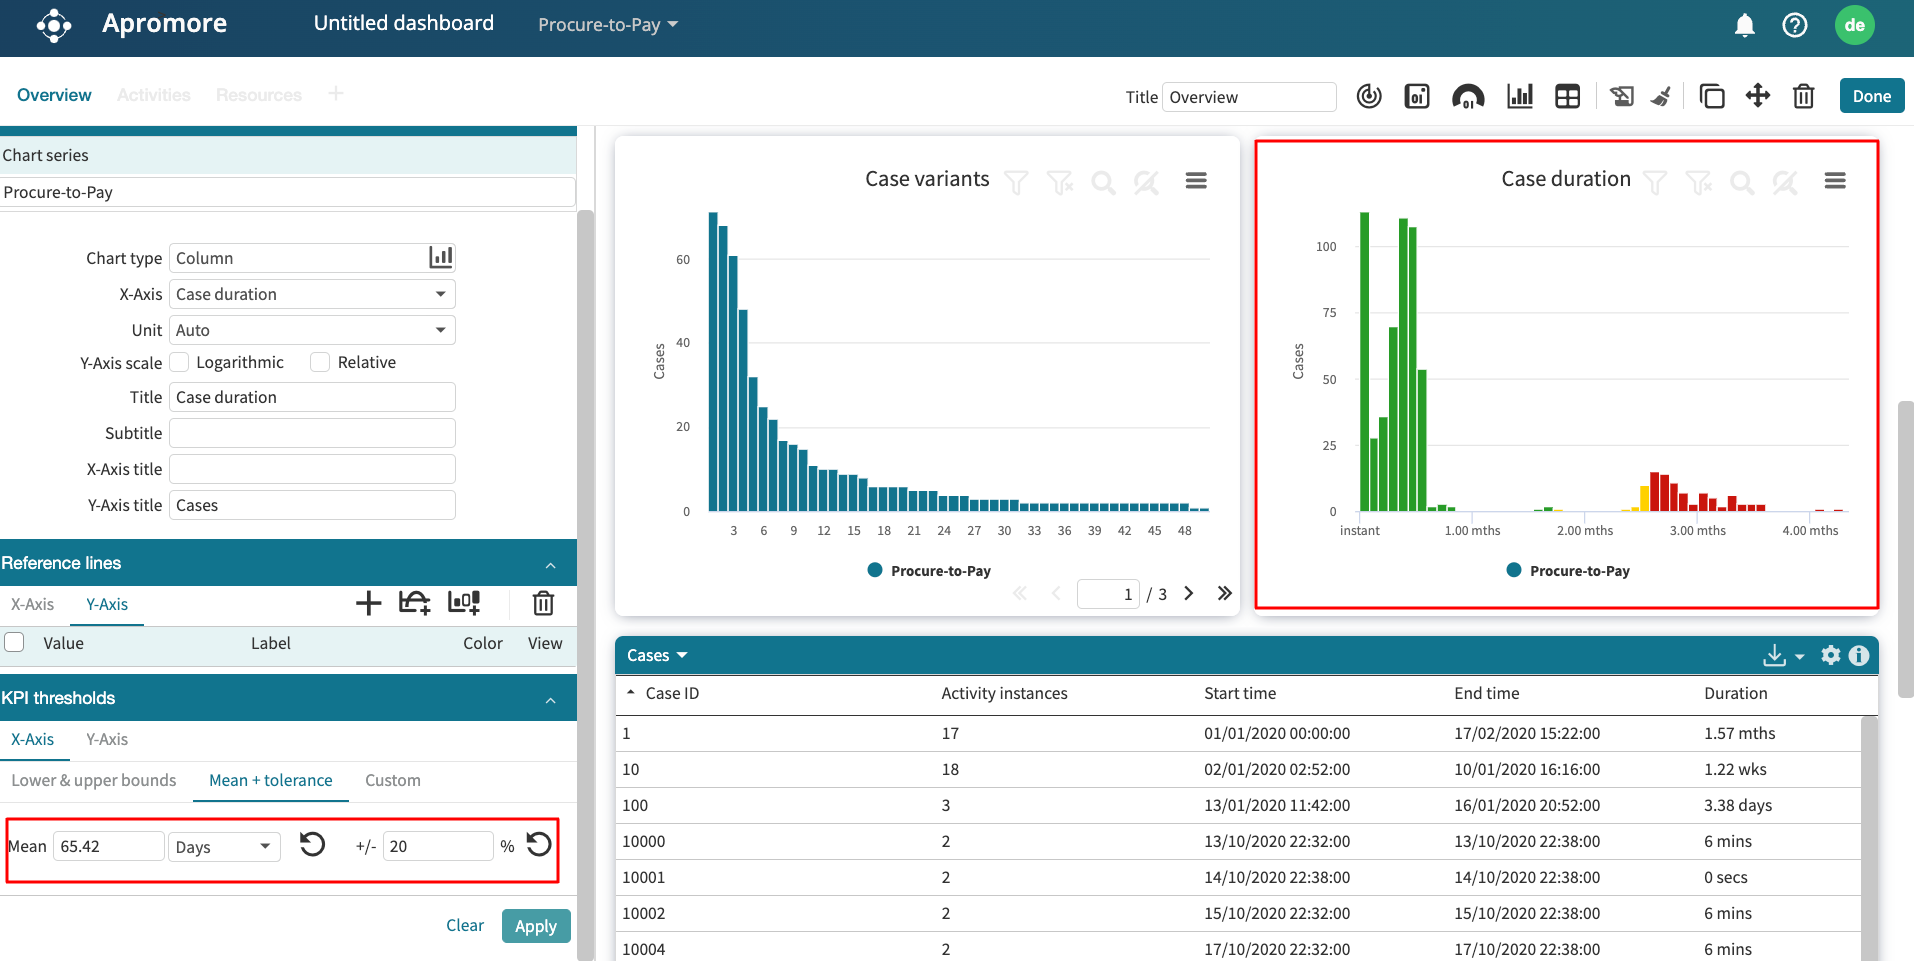
The case duration charts now color codes the chart based on the threshold.
When using the, Mean + Tolerance metric, we specify a mean performance metric with a specific tolerance (in percentage).
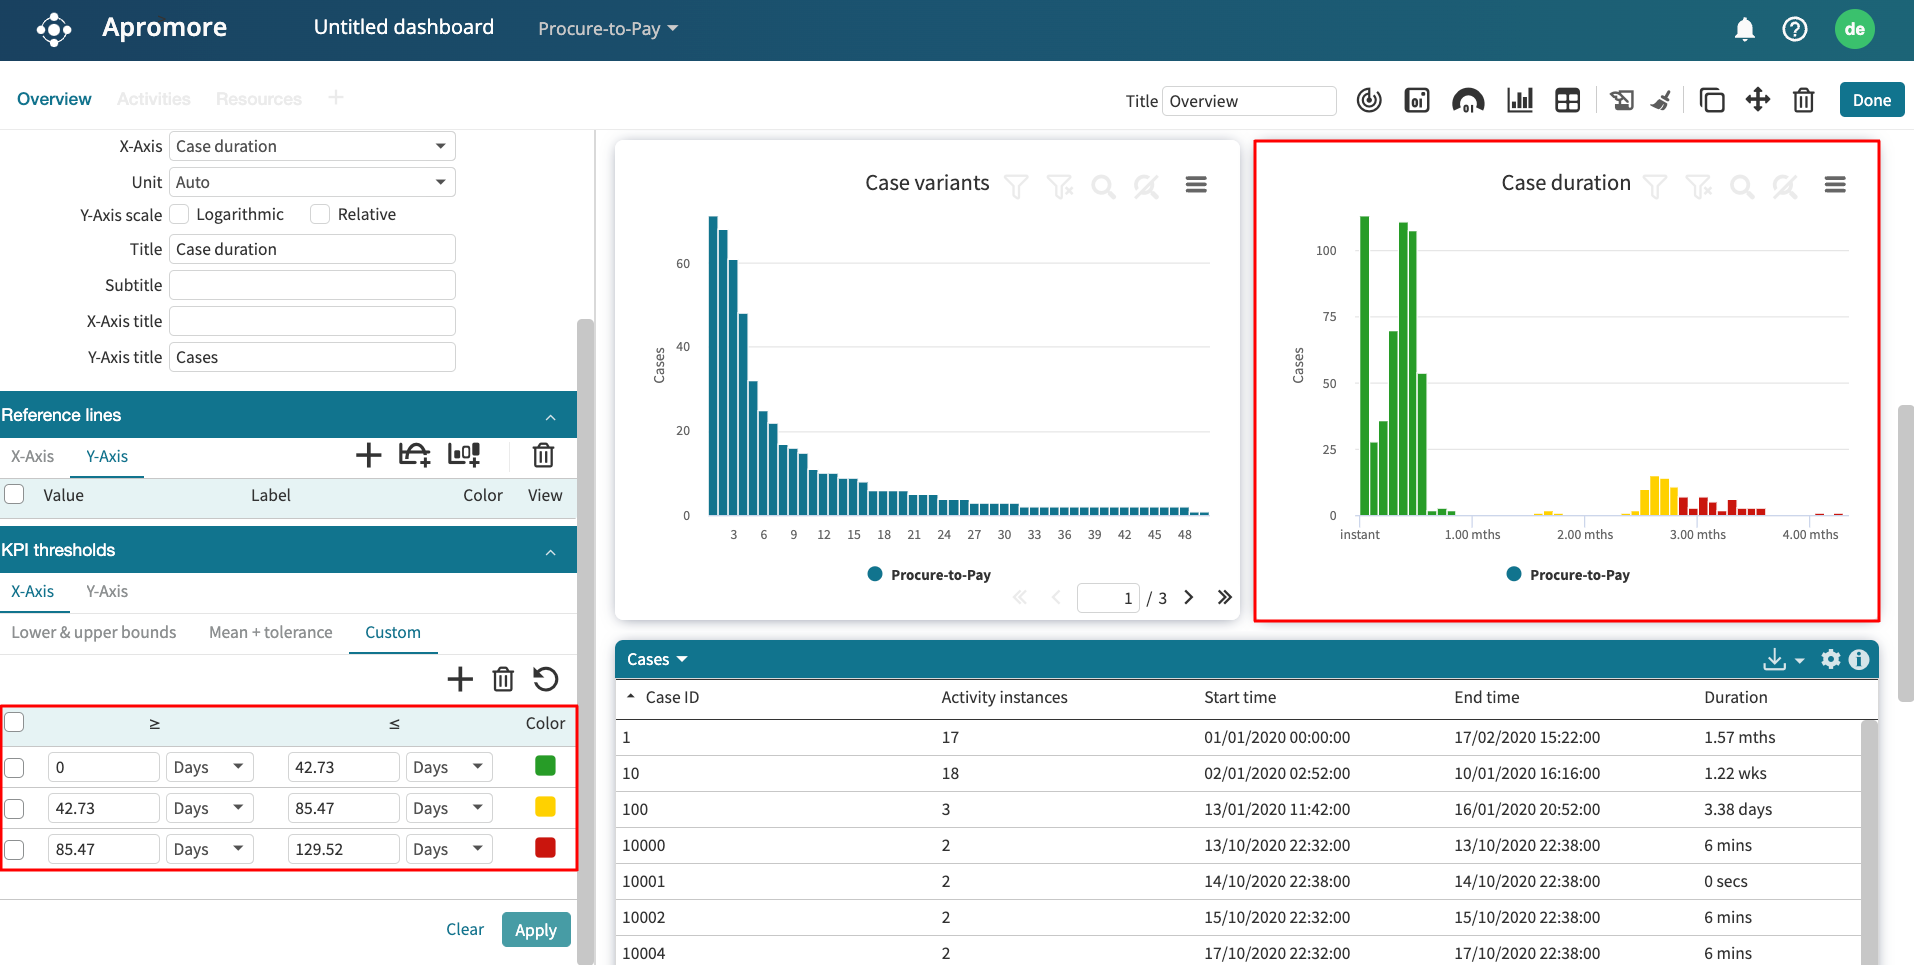
The Custom metric allows us to specify custom performance indicators.
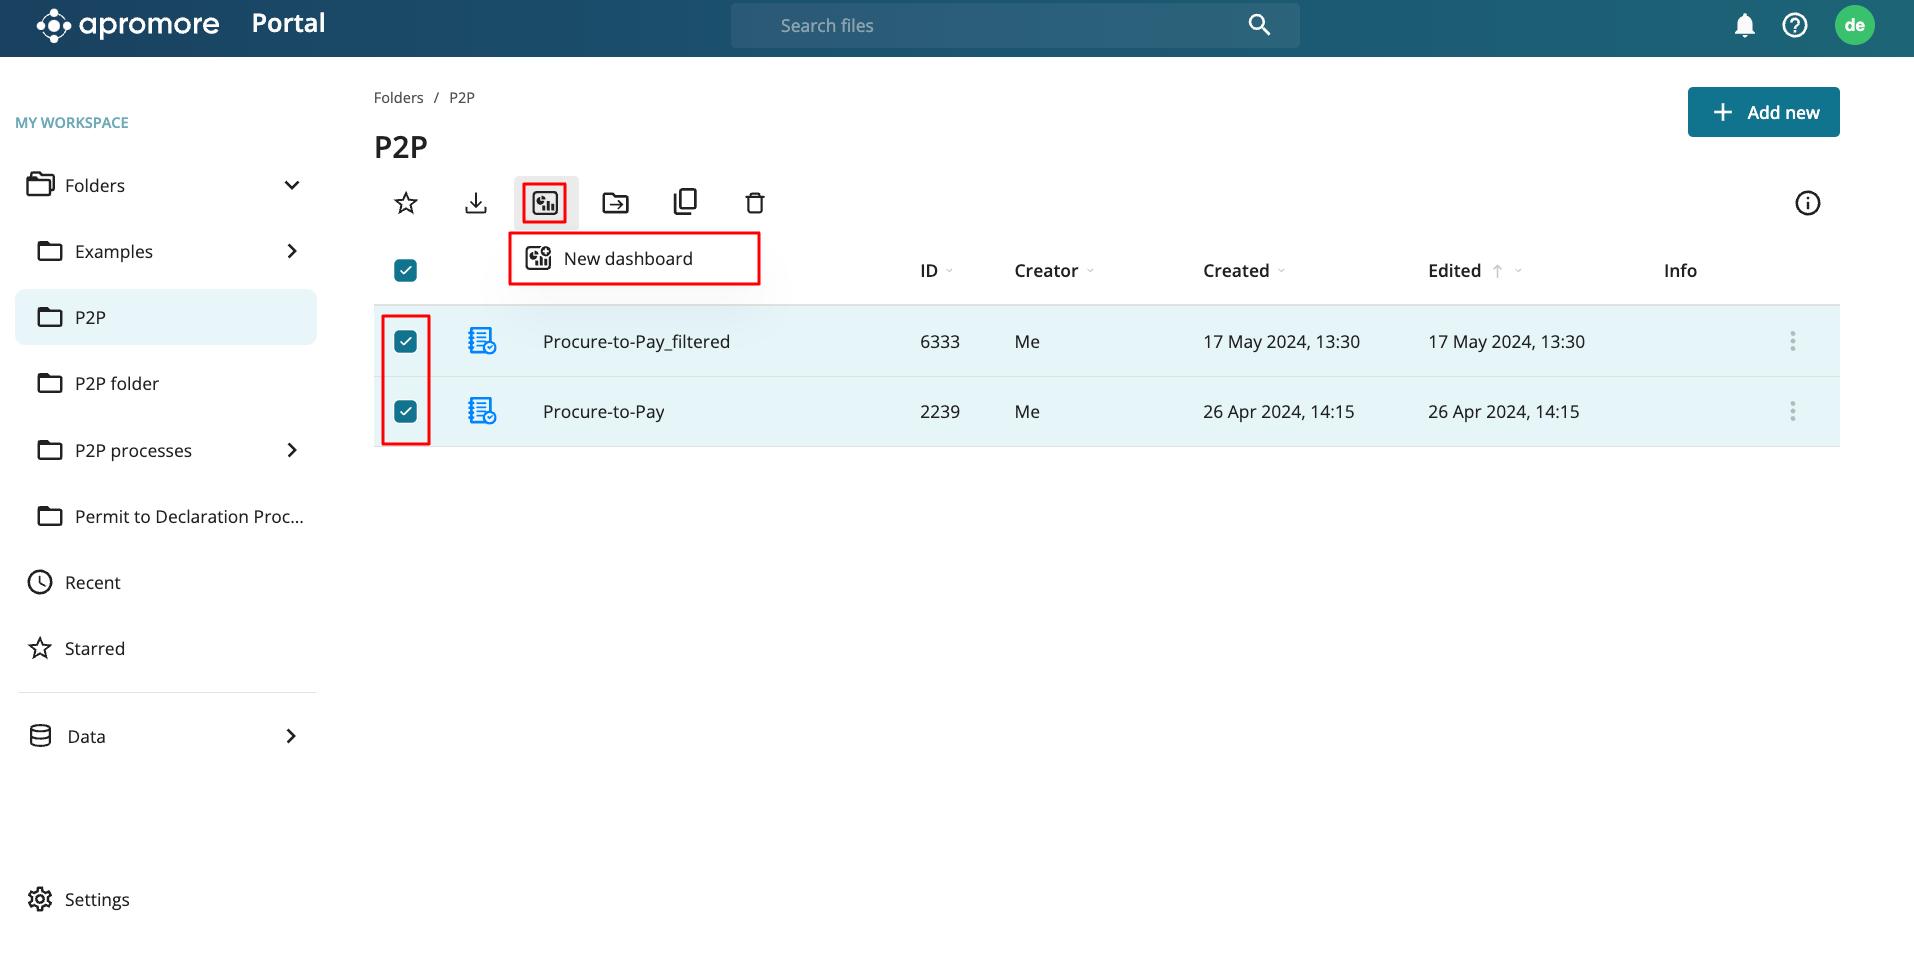
Compare multiple process variants
A performance dashboard not only helps us dive into the statistical metrics of a single event log but also helps us compare different versions of an event log. For this, select more than one version of the same event log. Click the dashboard icon and click New dashboard.
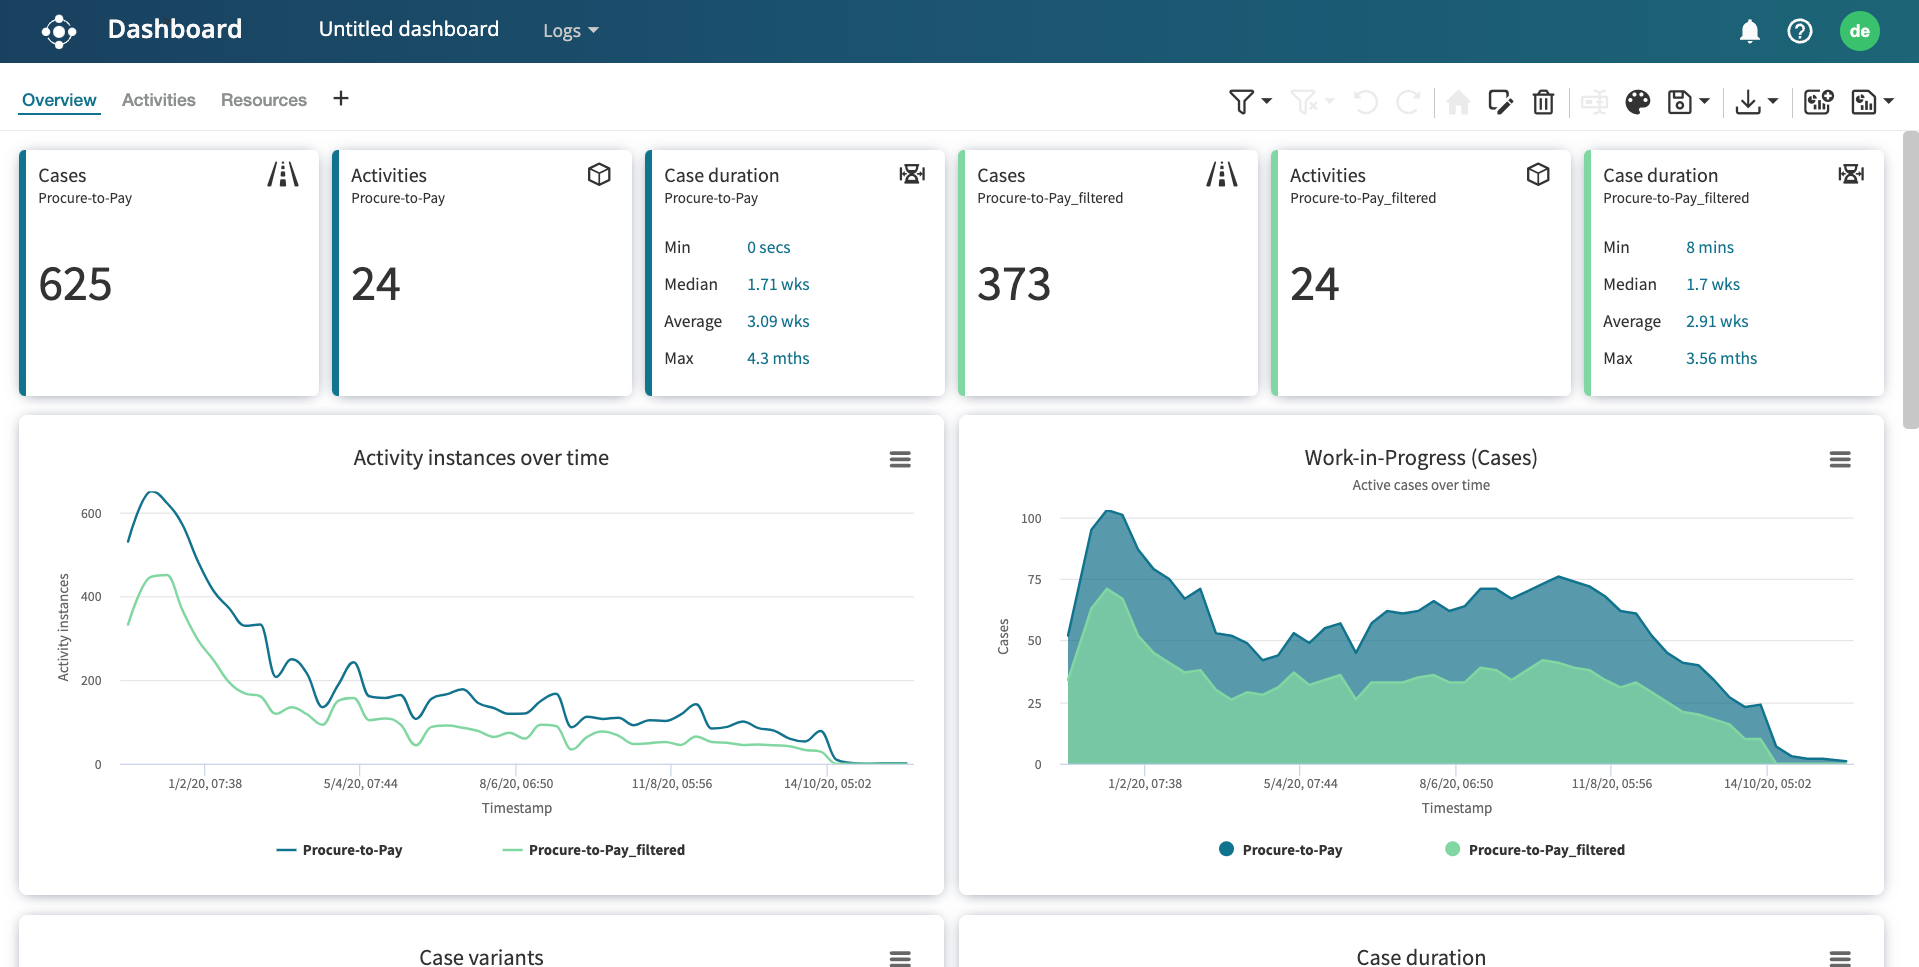
We see the charts of both the logs combined.
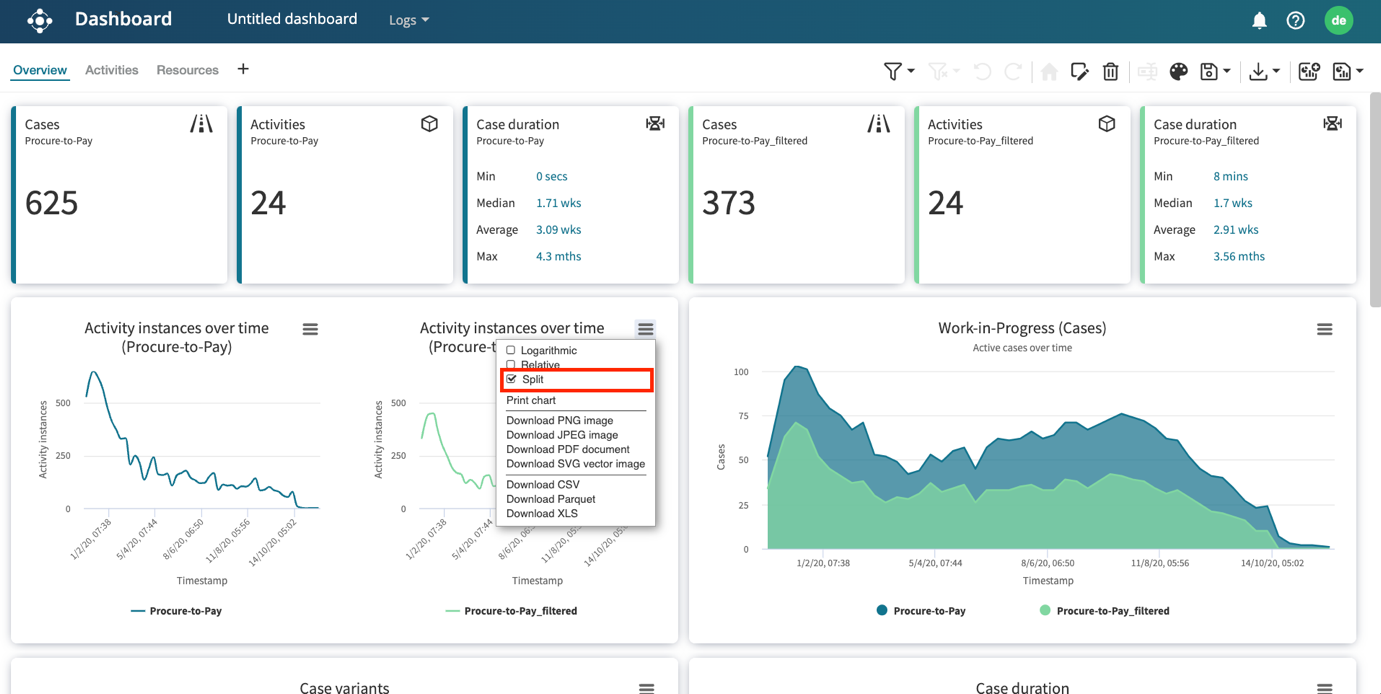
Split charts
When viewing multiple processes in a dashboard, we can also choose to split charts to compare multiple process variants.
Click  and check Split.
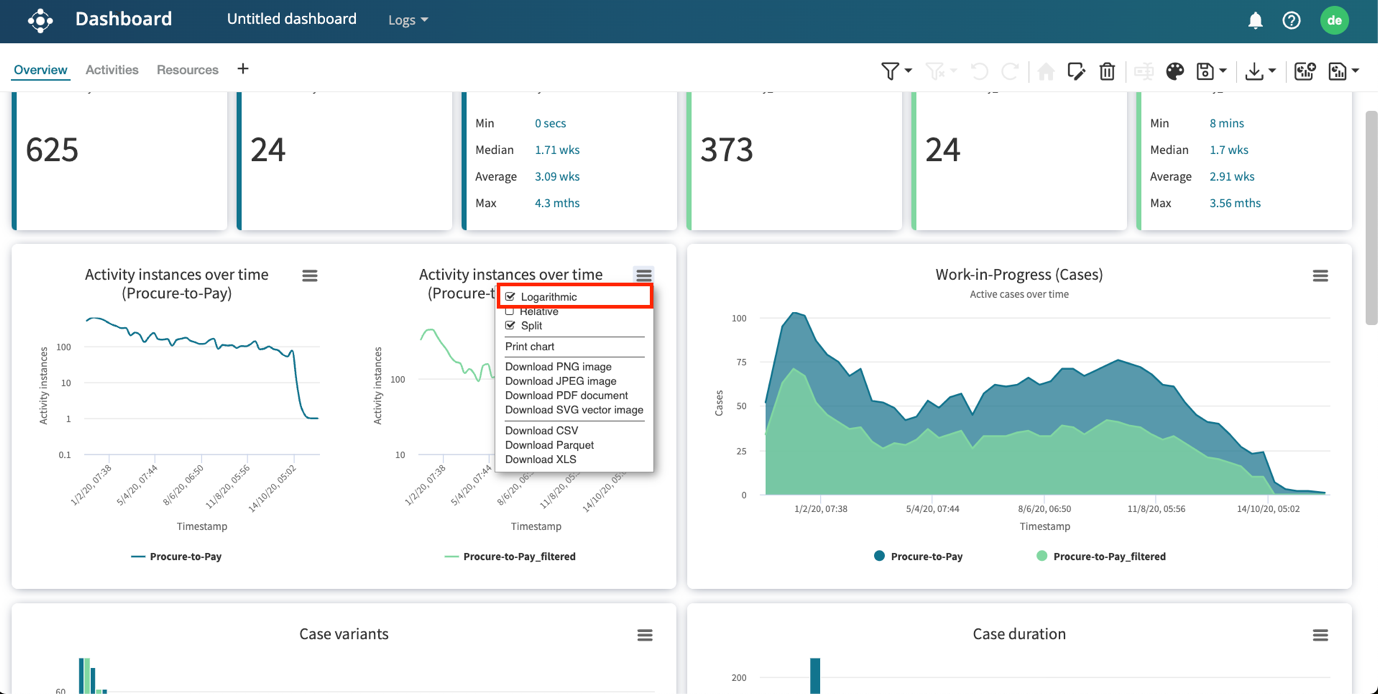
Change scale
The scale can also be changed to Logarithmic and Relative from Y-Axis scale.
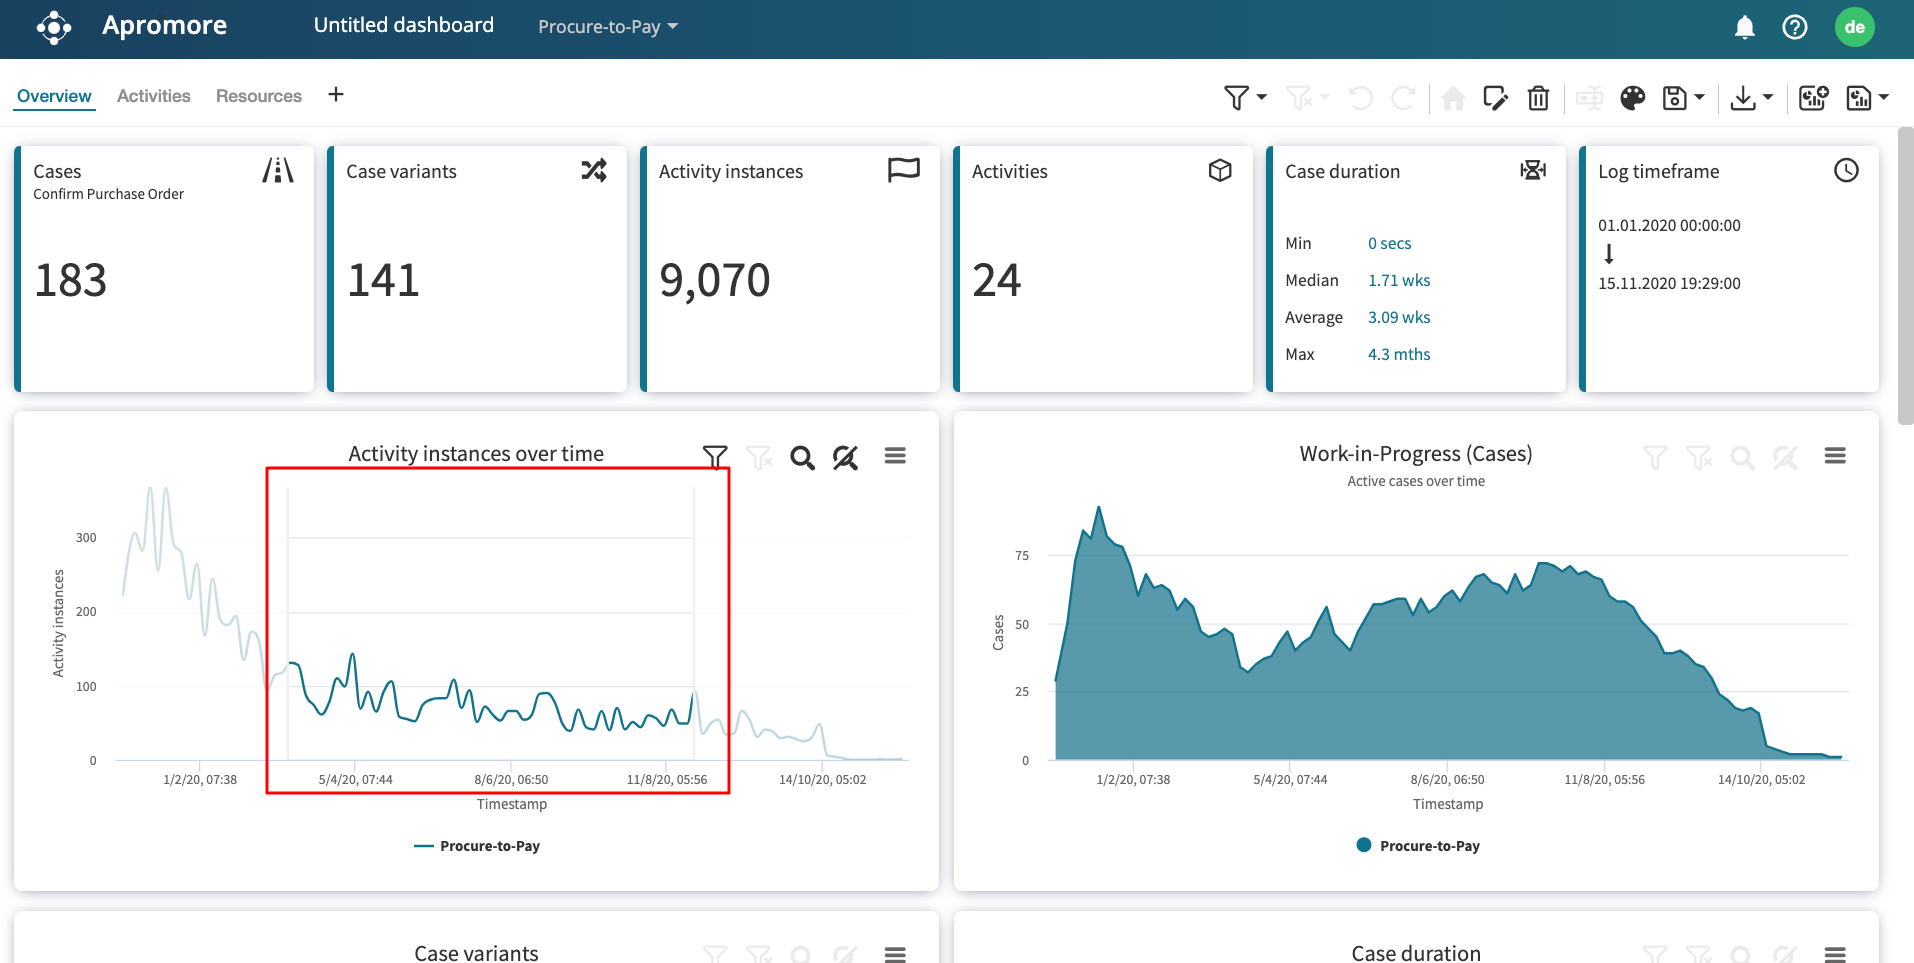
Zoom-in/Zoom-out
We can zoom into the graph by simply dragging the mouse over the part of the chart we would like to zoom.
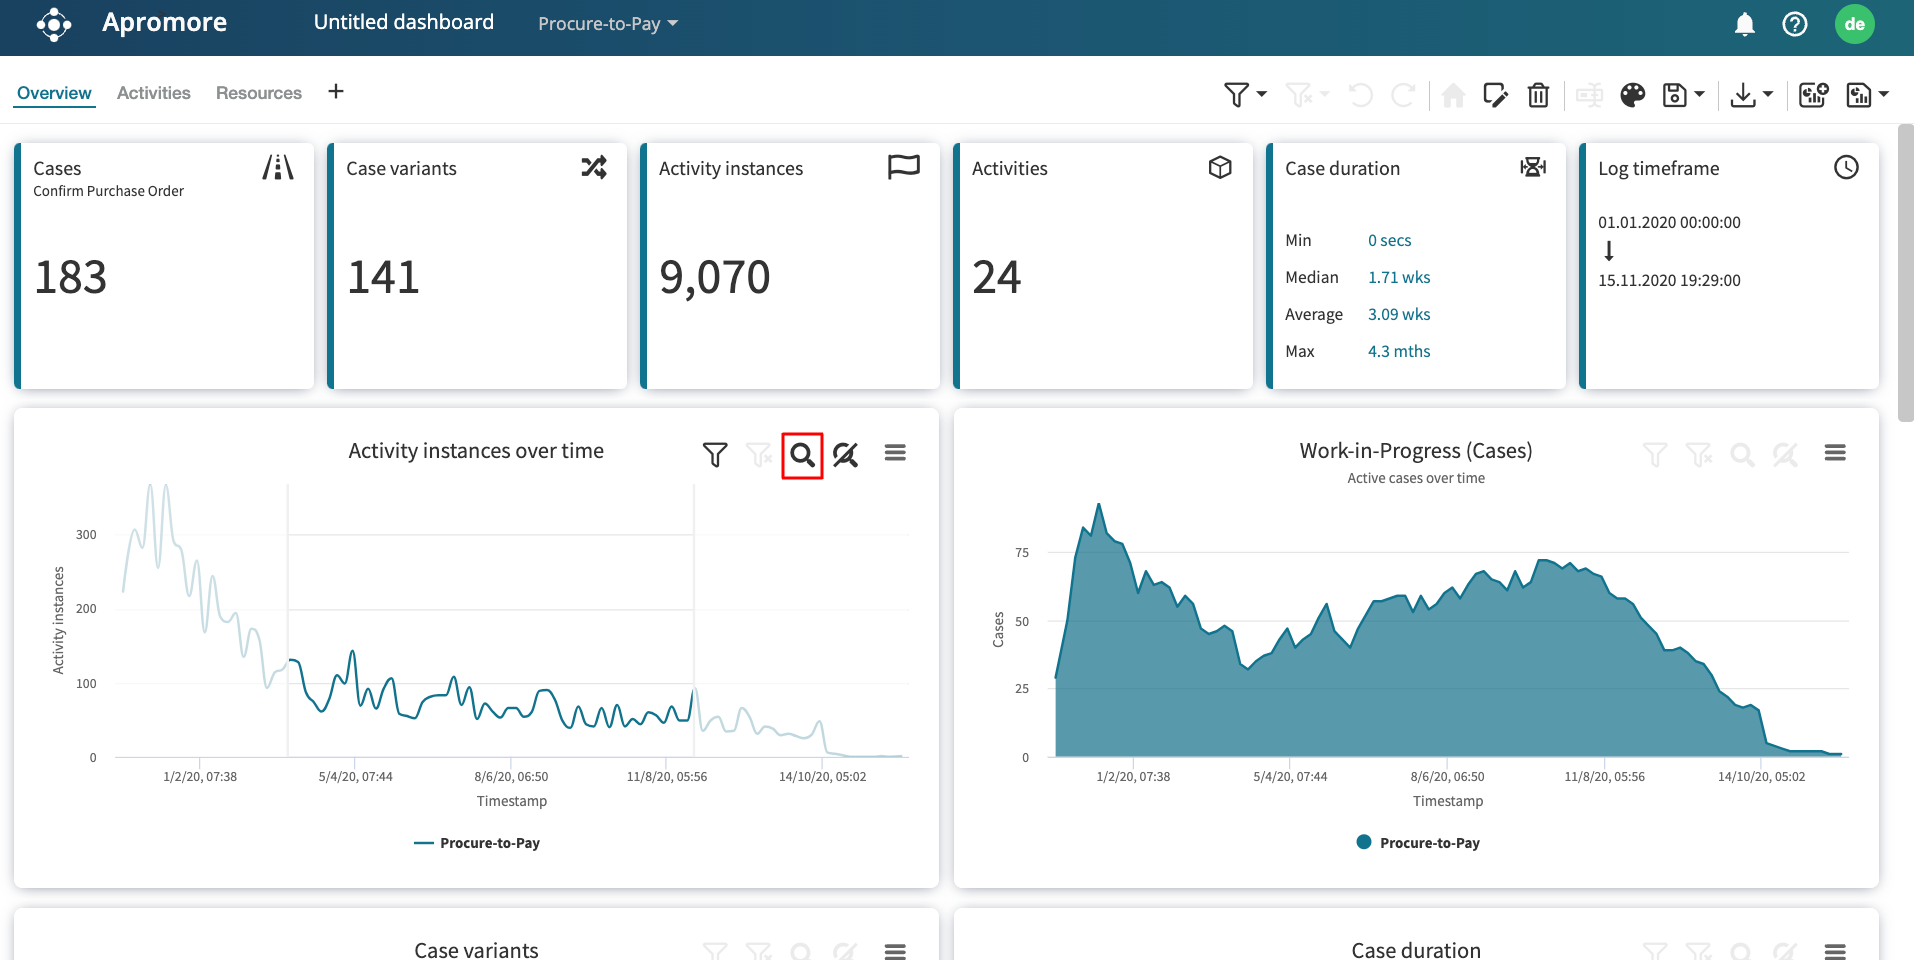
Click the zoom icon to display only the selected range.
The chart is zoomed in.
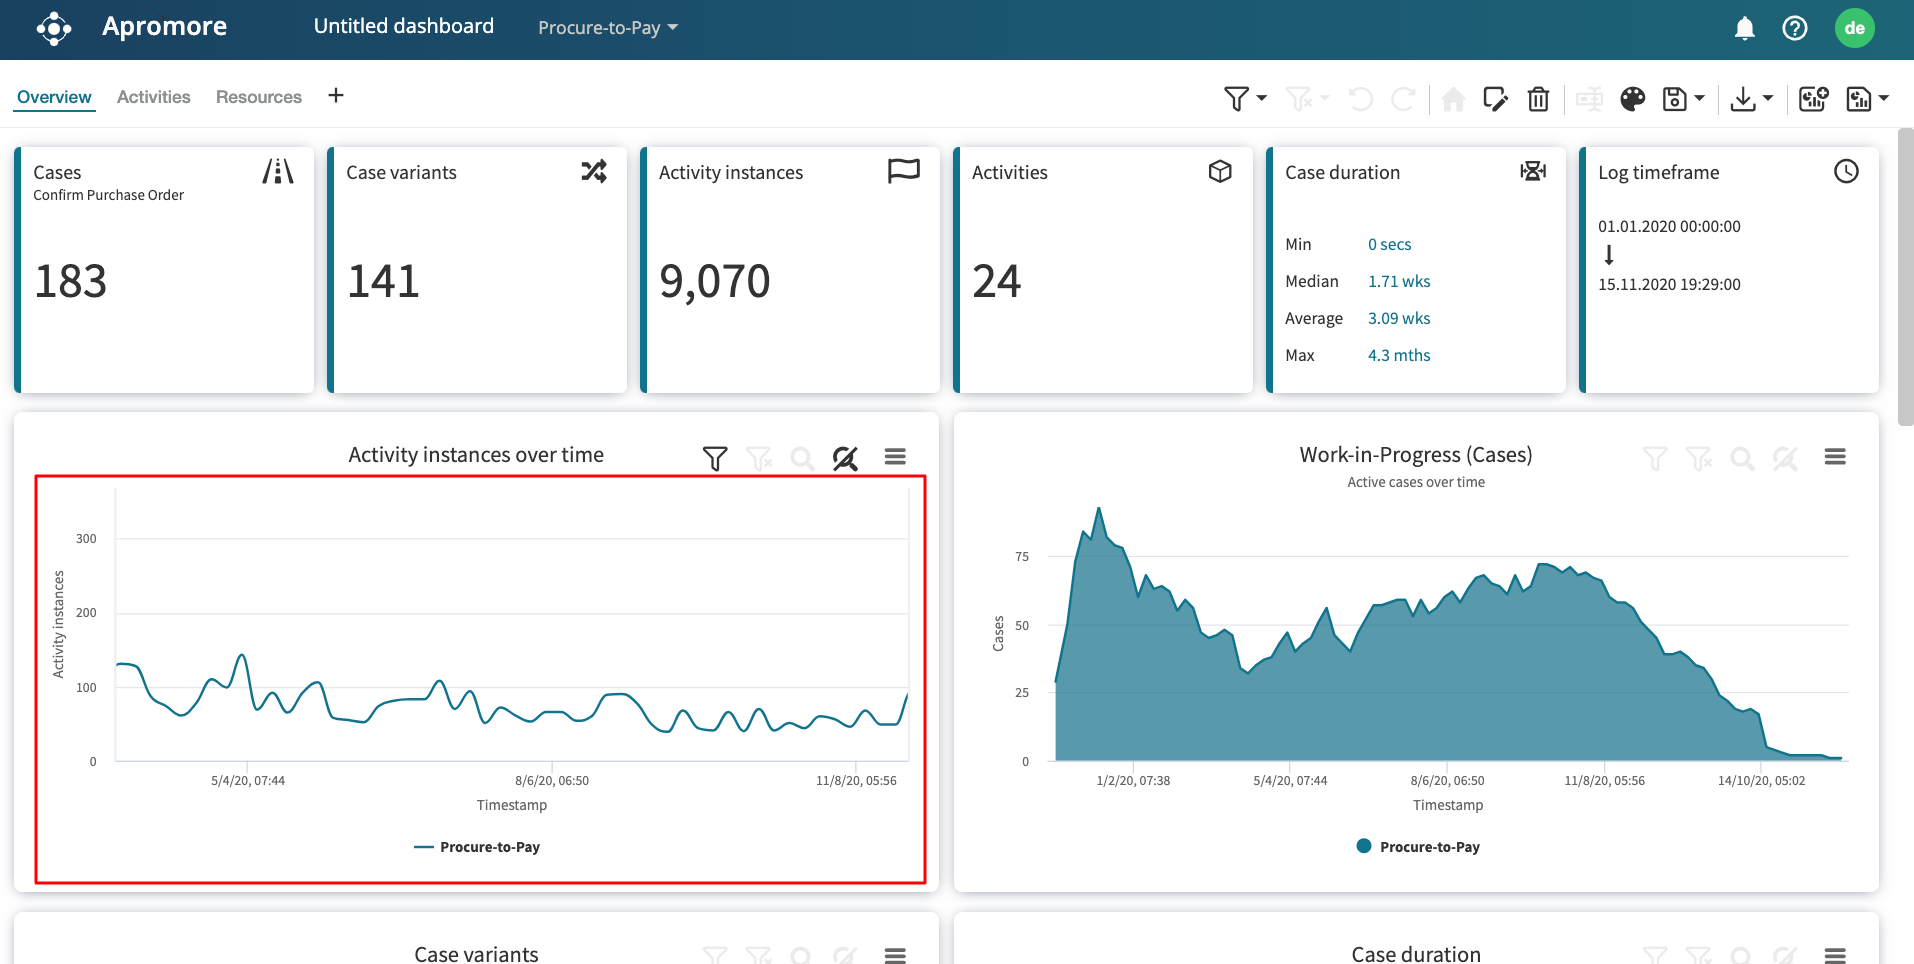
We can zoom out of the graph by clicking on Reset Zoom button.

Add filter
To add a filter, click on the drop-down button next to the log name. Select the log on which we wish to apply the filter.
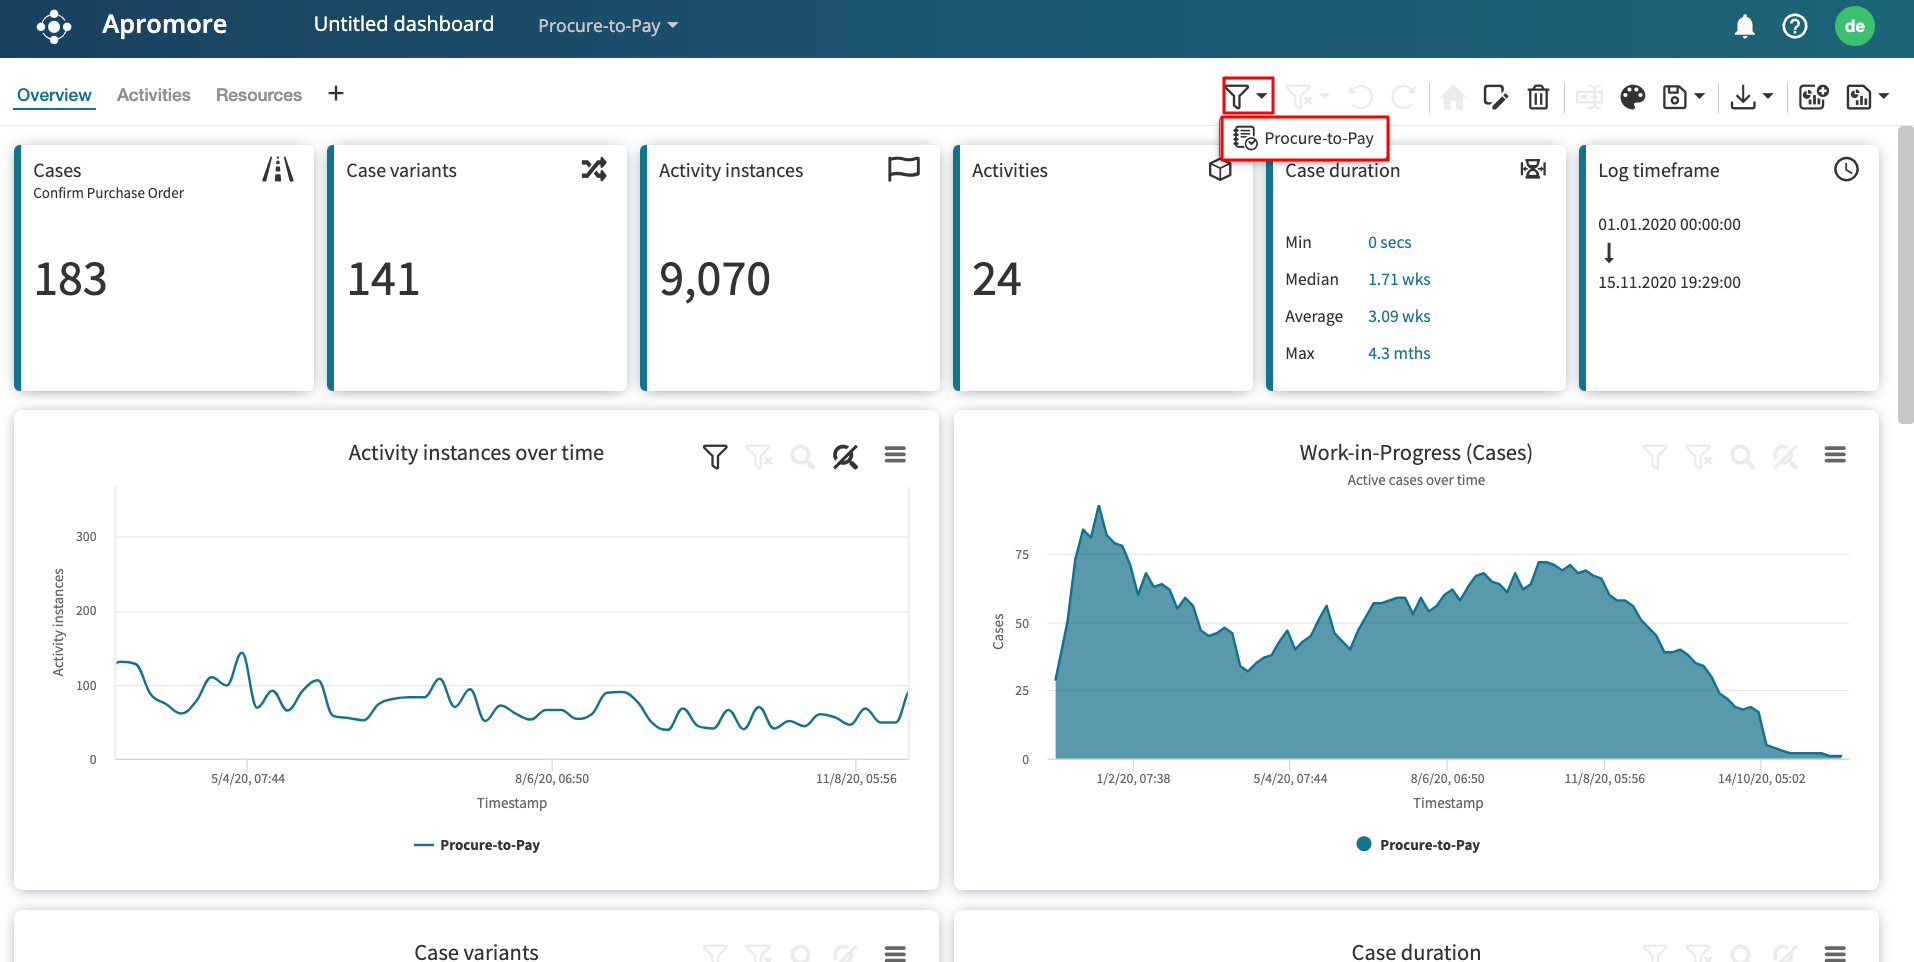
The displays the Filter log window. Select the desired filter and click Ok. To learn more about filters, see Types of filter criteria.
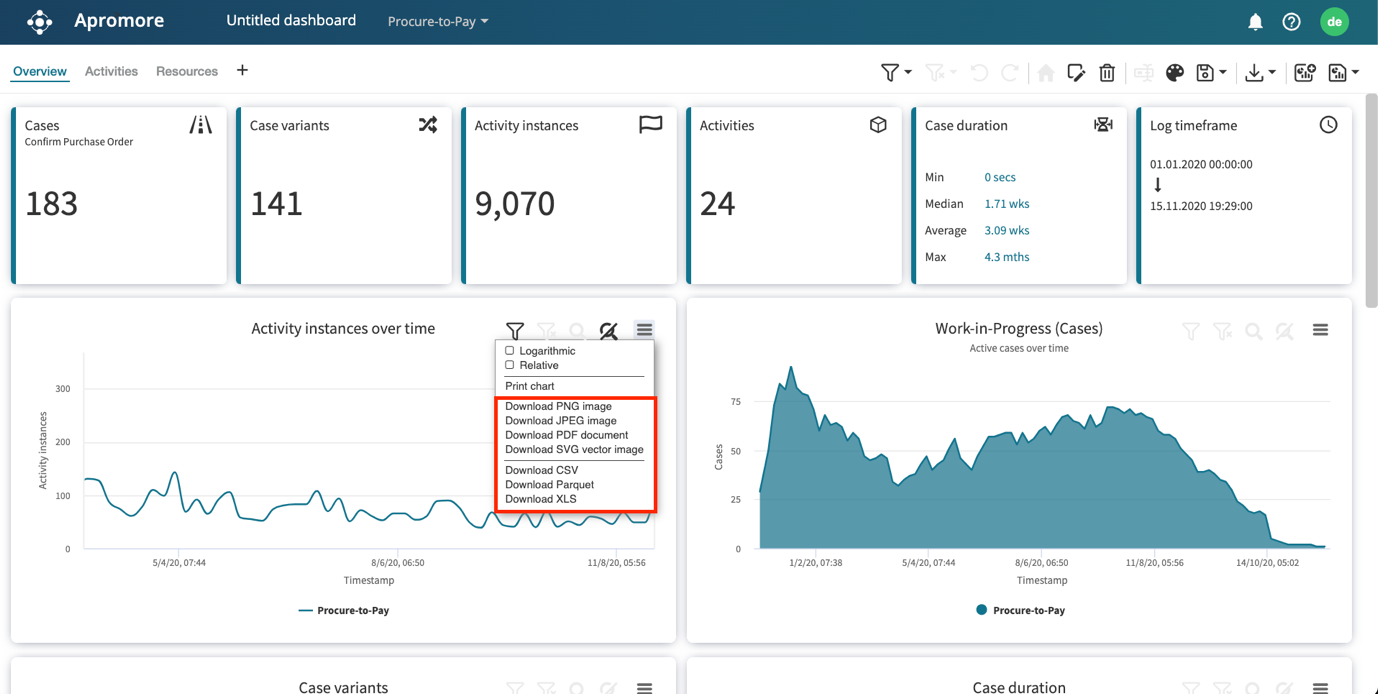
Export/download chart
We can also print or download a chart to a PNG, JPEG, PDF, SVG vector, CSV and XLS file.
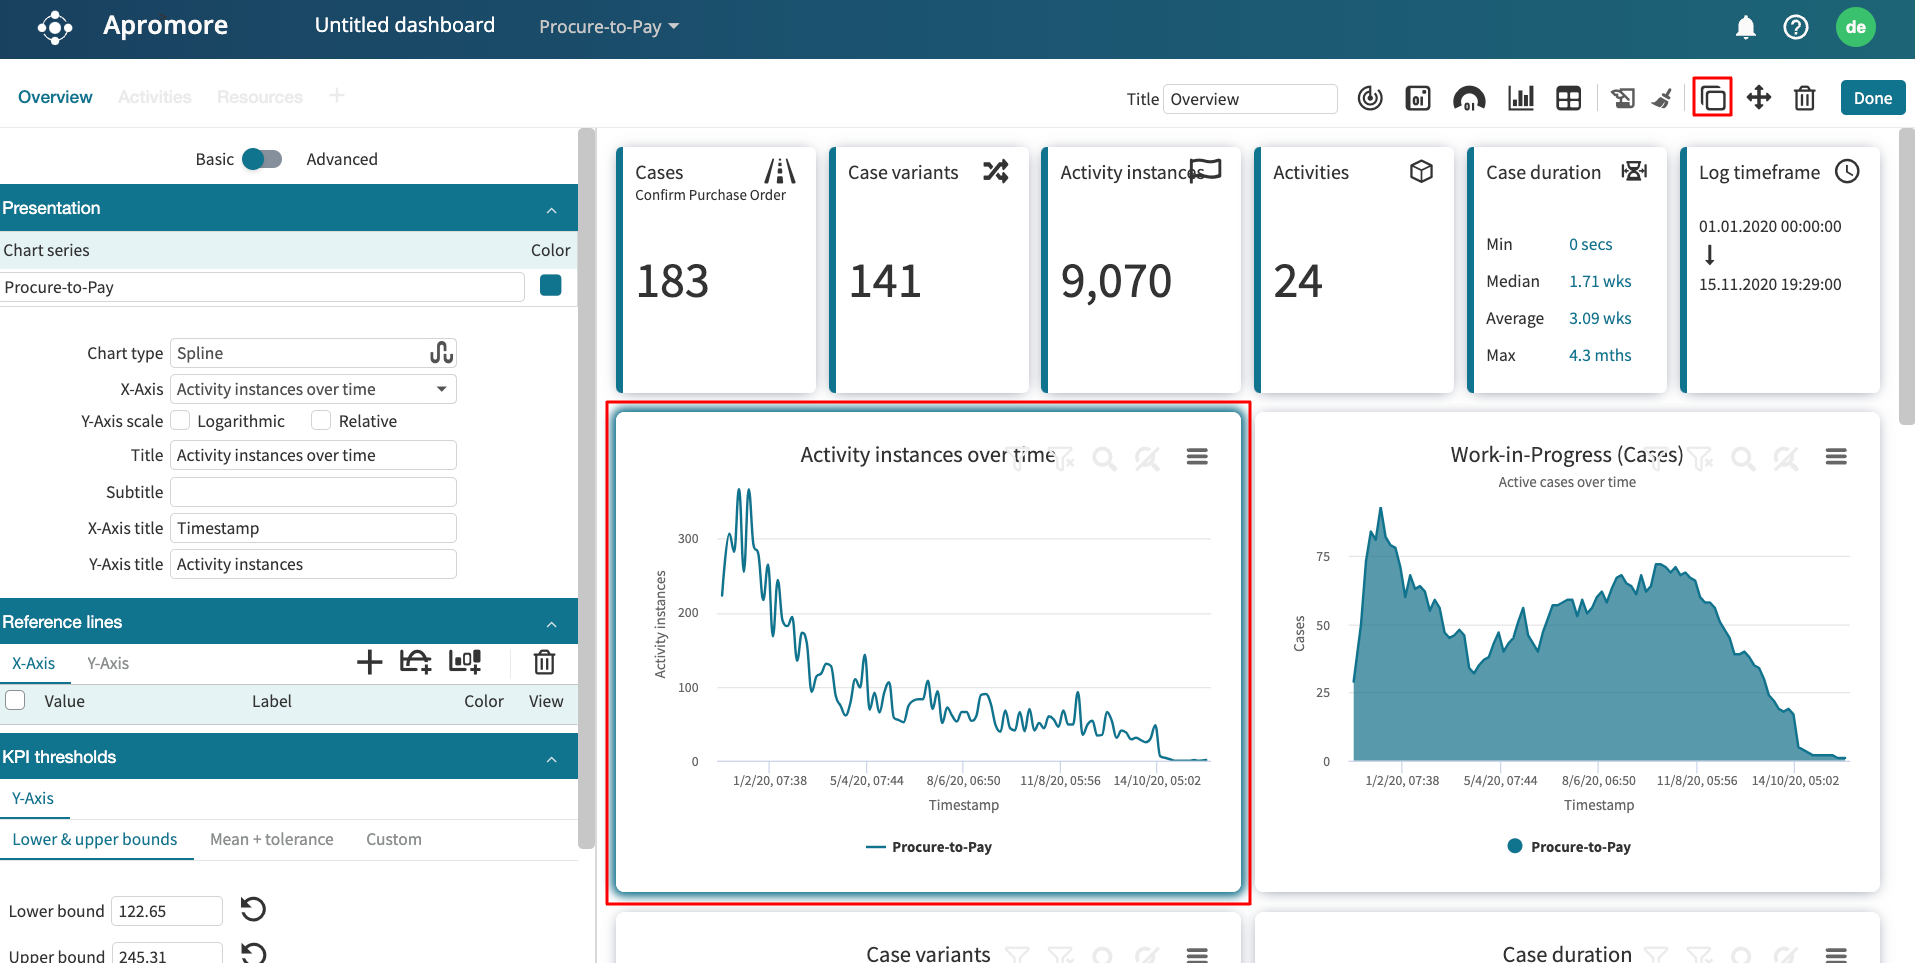
Clone chart
Cloning a chart allows us to replicate the same chart. To add the same chart again, click Edit view, select the chart and click on Clone content.
Organize charts
In the case of multiple charts/stats, we can re-arrange them by clicking on the  button and simply moving the charts/stats using the drag-
and-drop method.
Click the move button once to move a selected block.
Click the move button twice to move all the blocks.
button and simply moving the charts/stats using the drag-
and-drop method.
Click the move button once to move a selected block.
Click the move button twice to move all the blocks.

Remove chart/tile/table
In order to remove a chart/table/block, select a chart and click on  .
.

Copy format
To copy the formatting settings used in one block to another block, select a chart/tile/table and click on the  button.
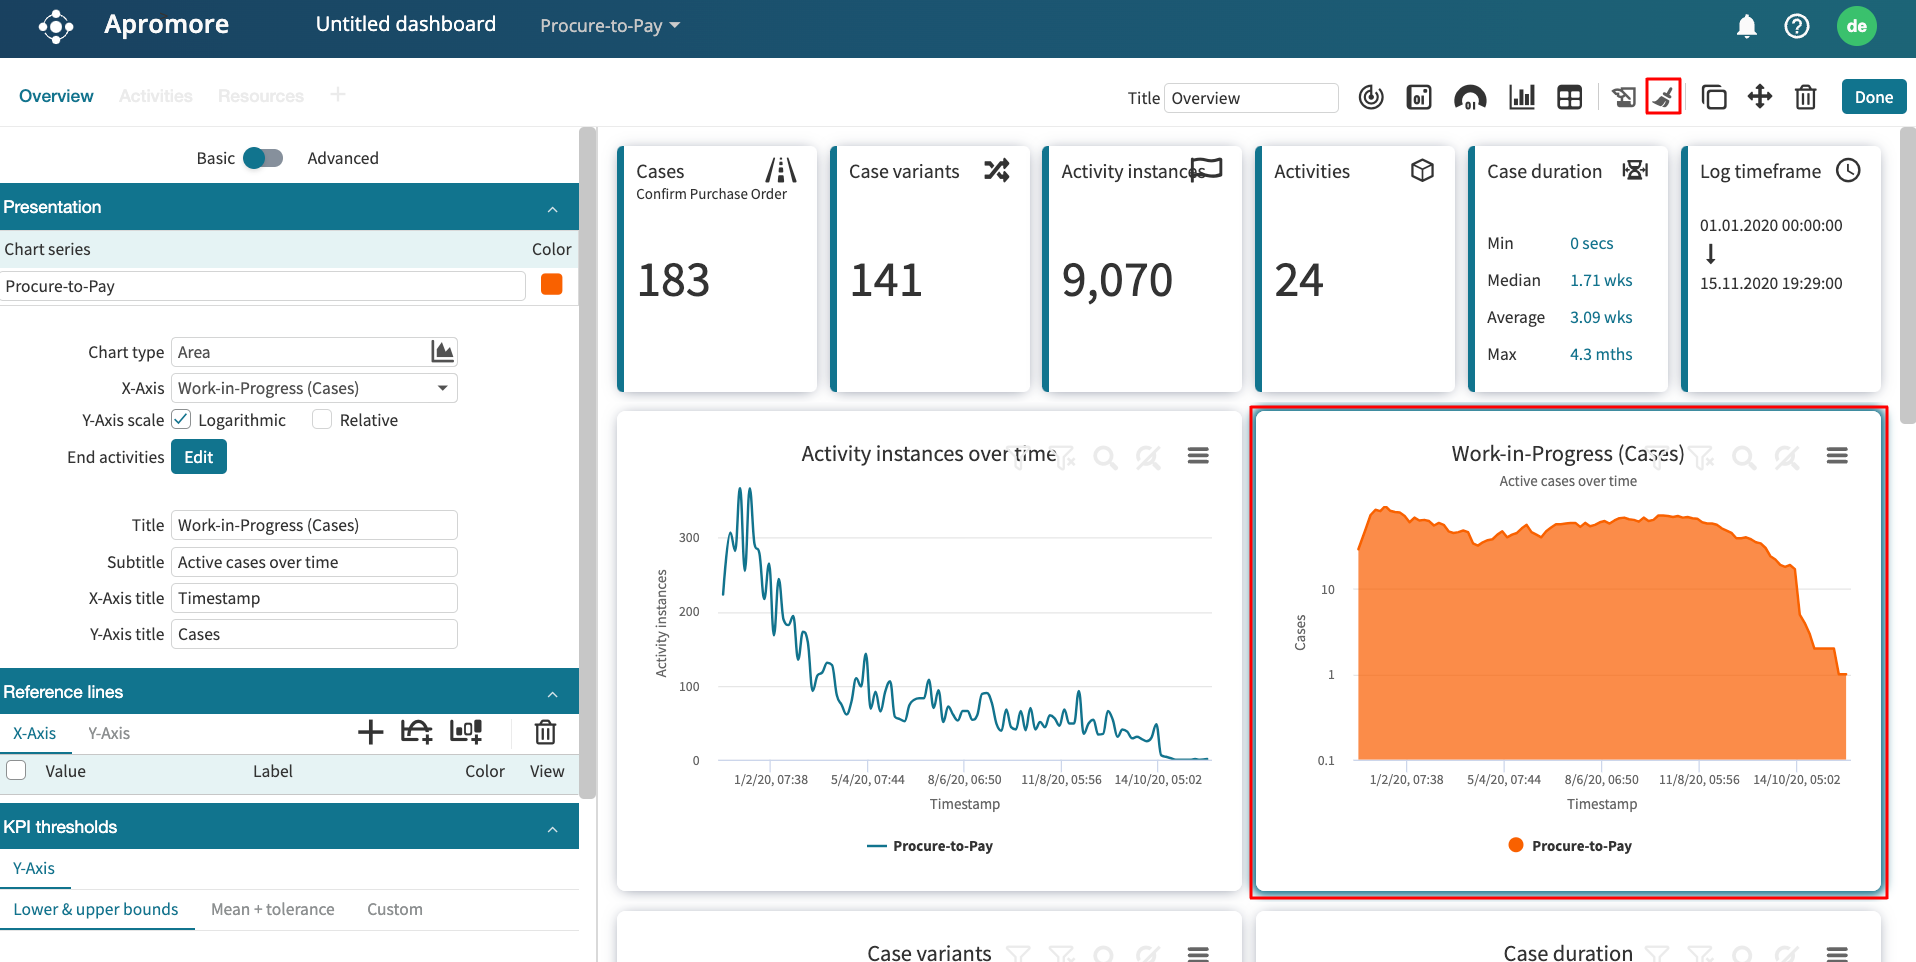
This displays the styles that will be copied.
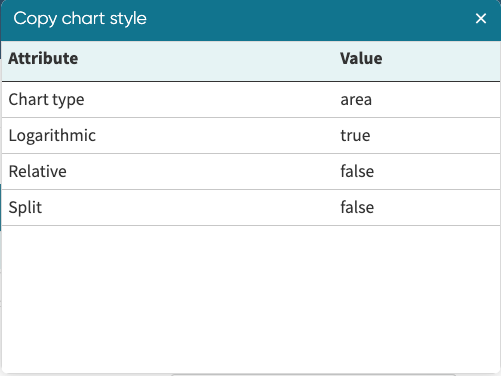
Click on another block to paste the formatting settings.
Copy Settings
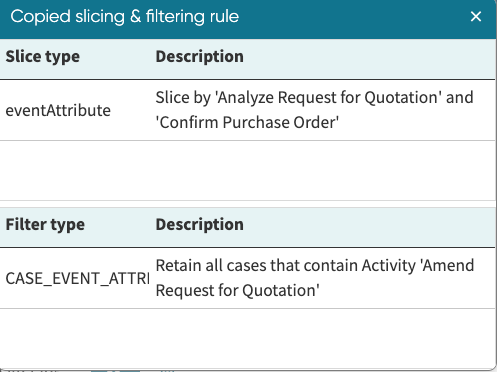
To copy the filter and slicing rules from one block to another, select the block and click on the  button.
We can see the slicing and filtering rules of the block to be copied.
Click on another block to paste the settings.
Download dashboard
To download the current view of the dashboard, click the necessary format type.
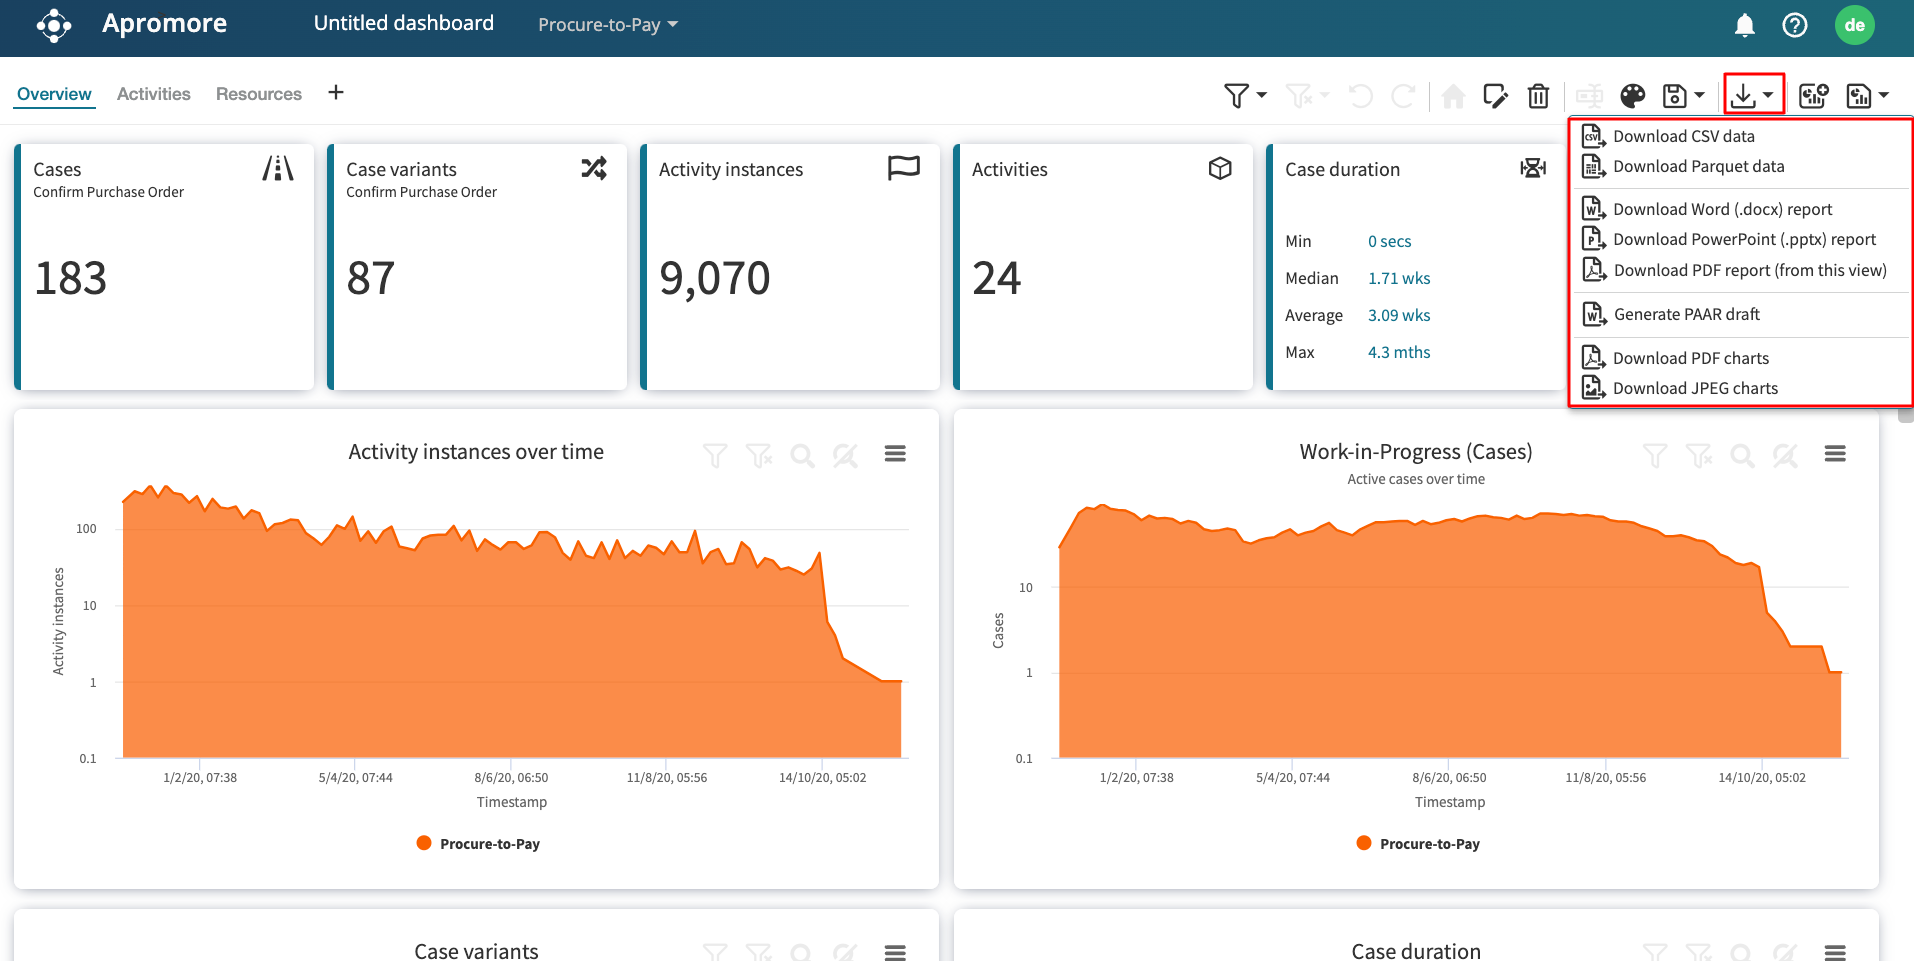
We can download selected blocks in a view, an entire view, or all the views in the dashboard.
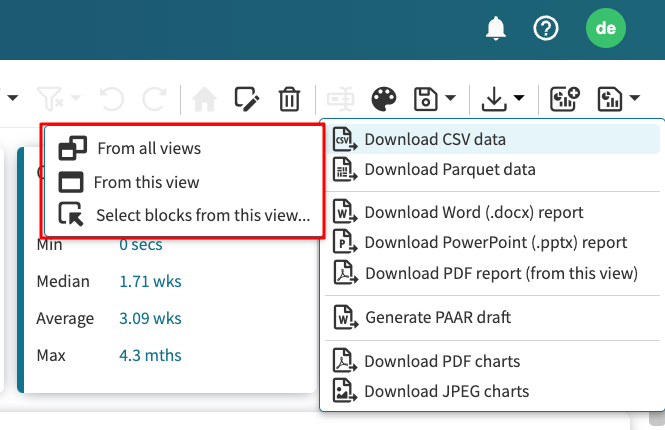
Follow the prompts to download.
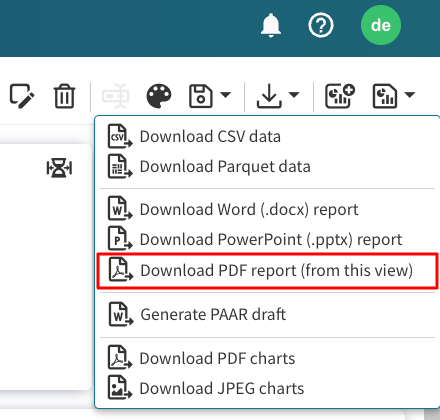
For reporting purposes, we can also download a dashboard view as a PDF file. The PDF will render all charts, tables, tiles, or KPIs in the view. To download a PDF report, click the download icon.

Click Download PDF report (from this view).
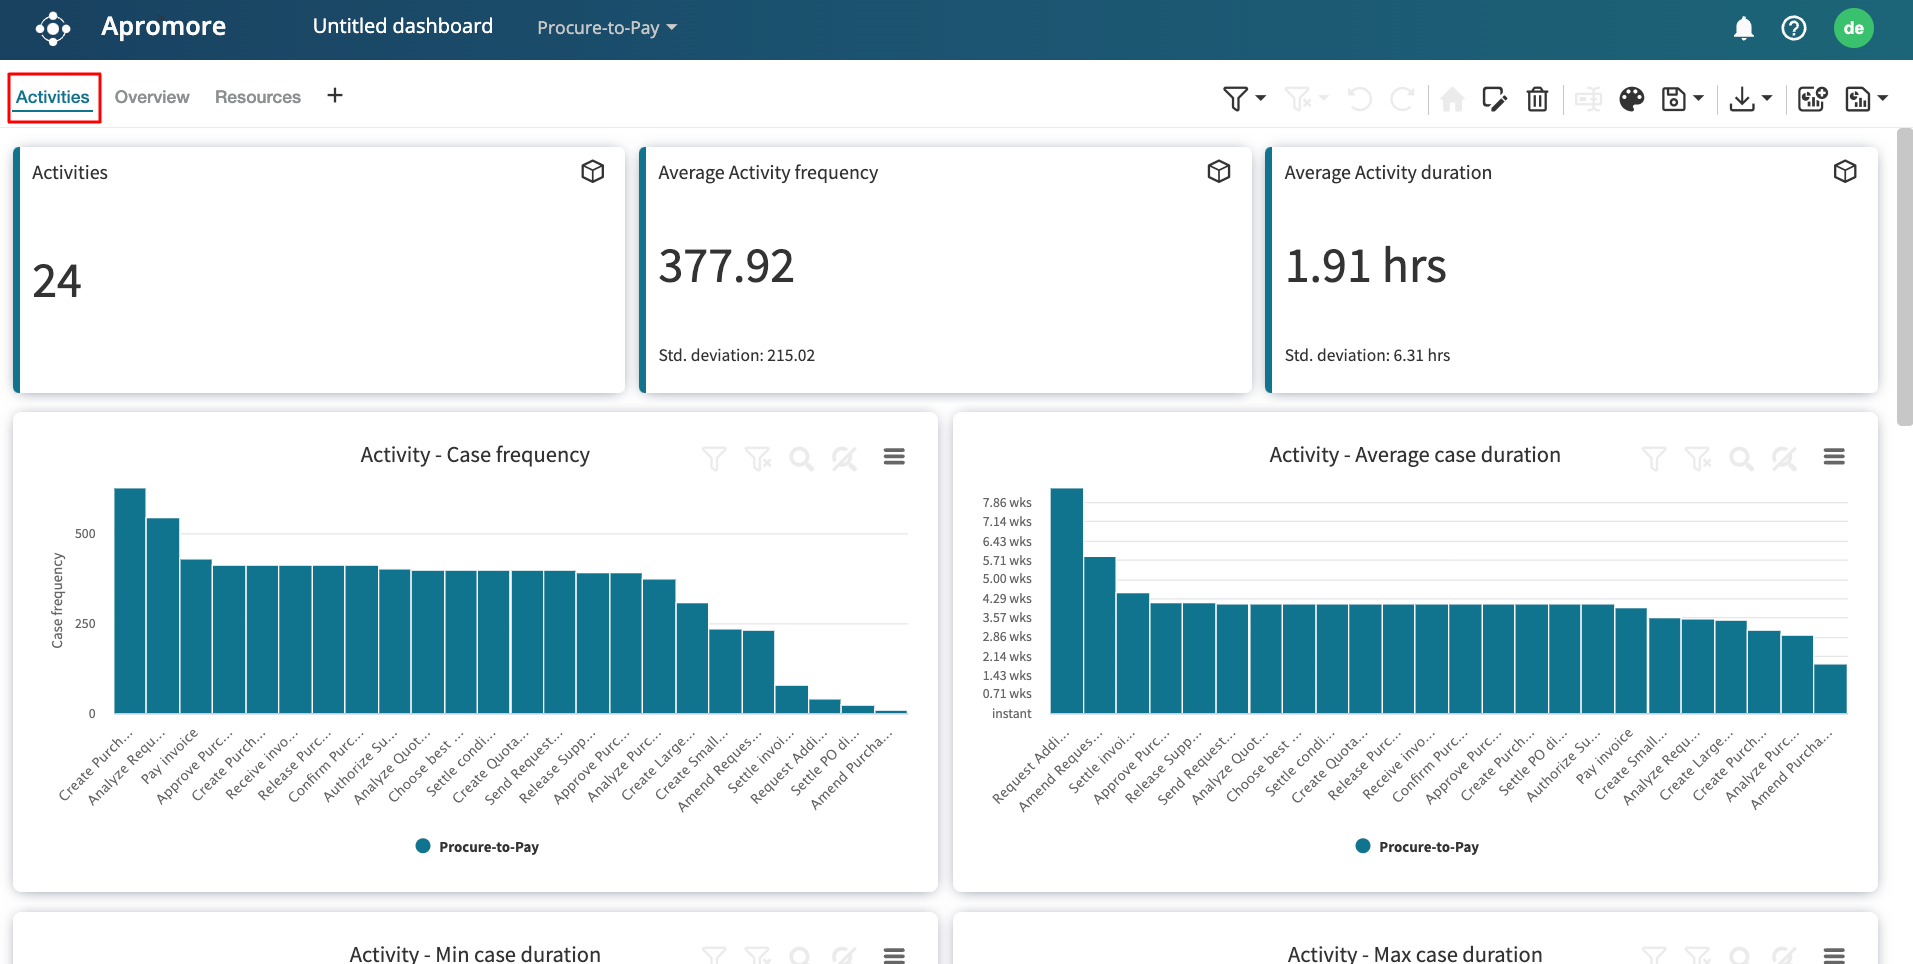
Set a Dashboard view as “Home”
For ease of access, we can set a dashboard as Home by clicking on the  button.
This means the view will appear first in the dashboard.
button.
This means the view will appear first in the dashboard.
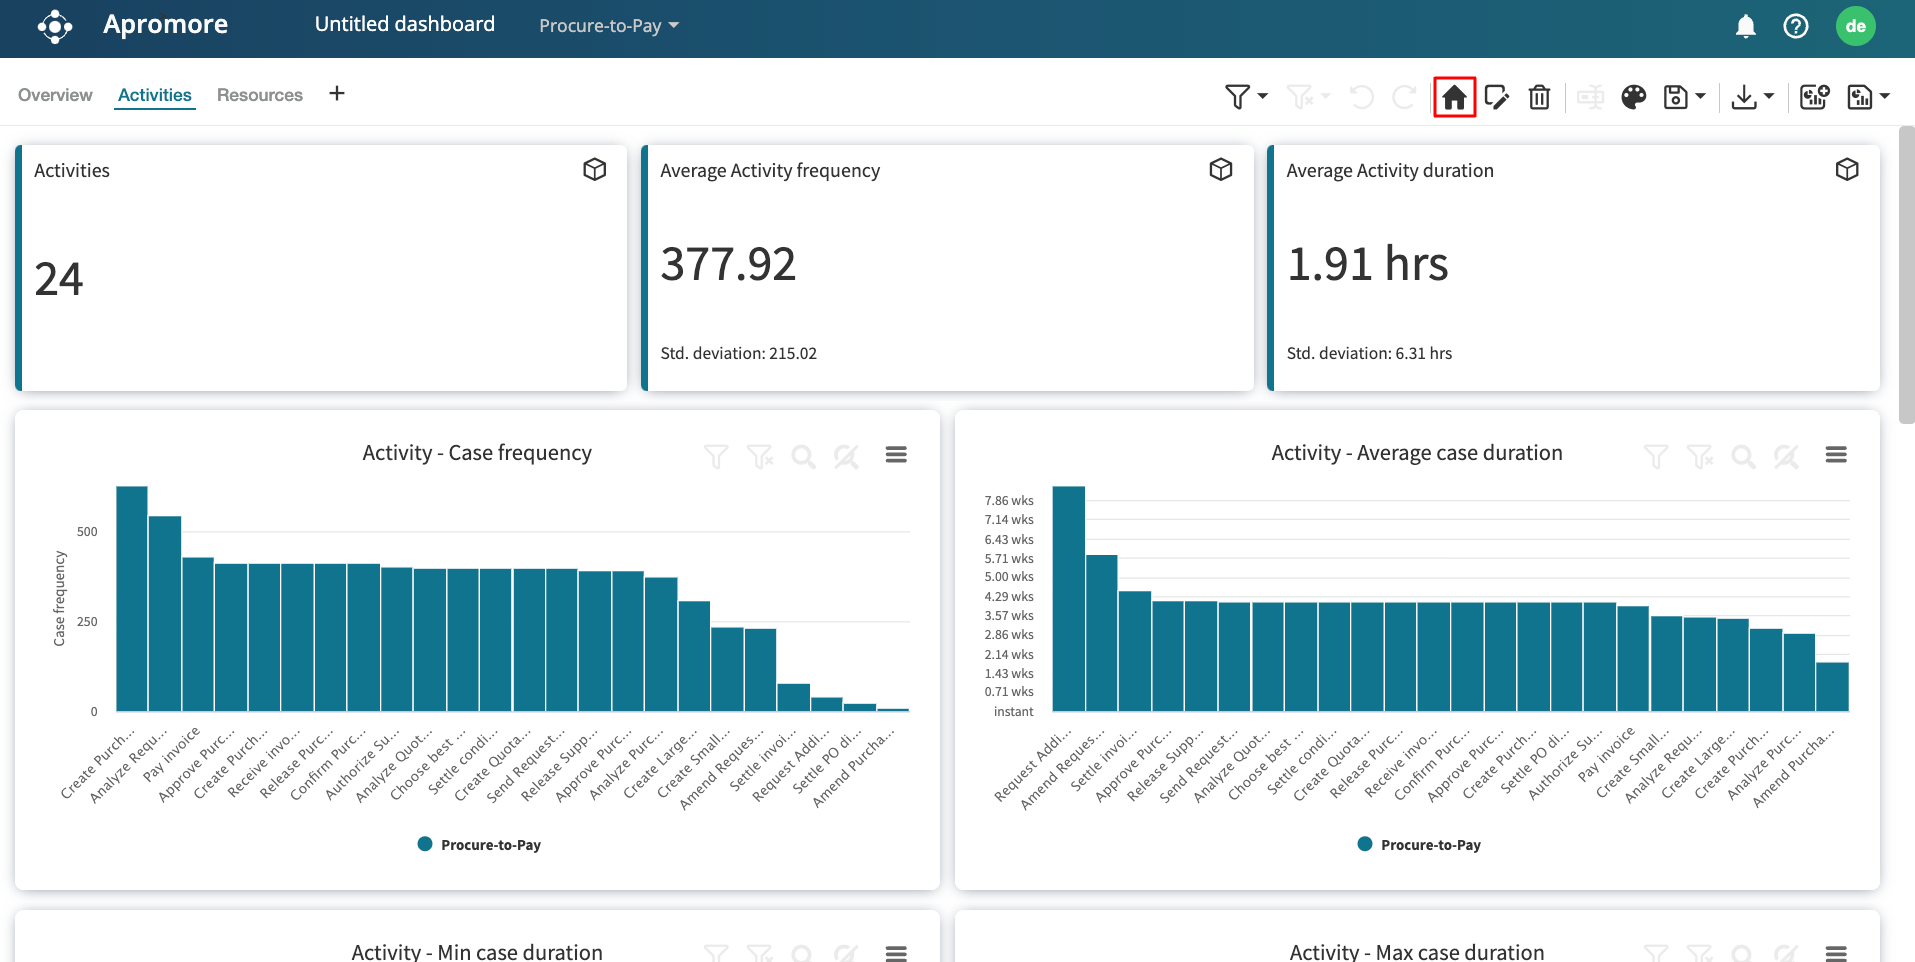
The Activities view now appears first.
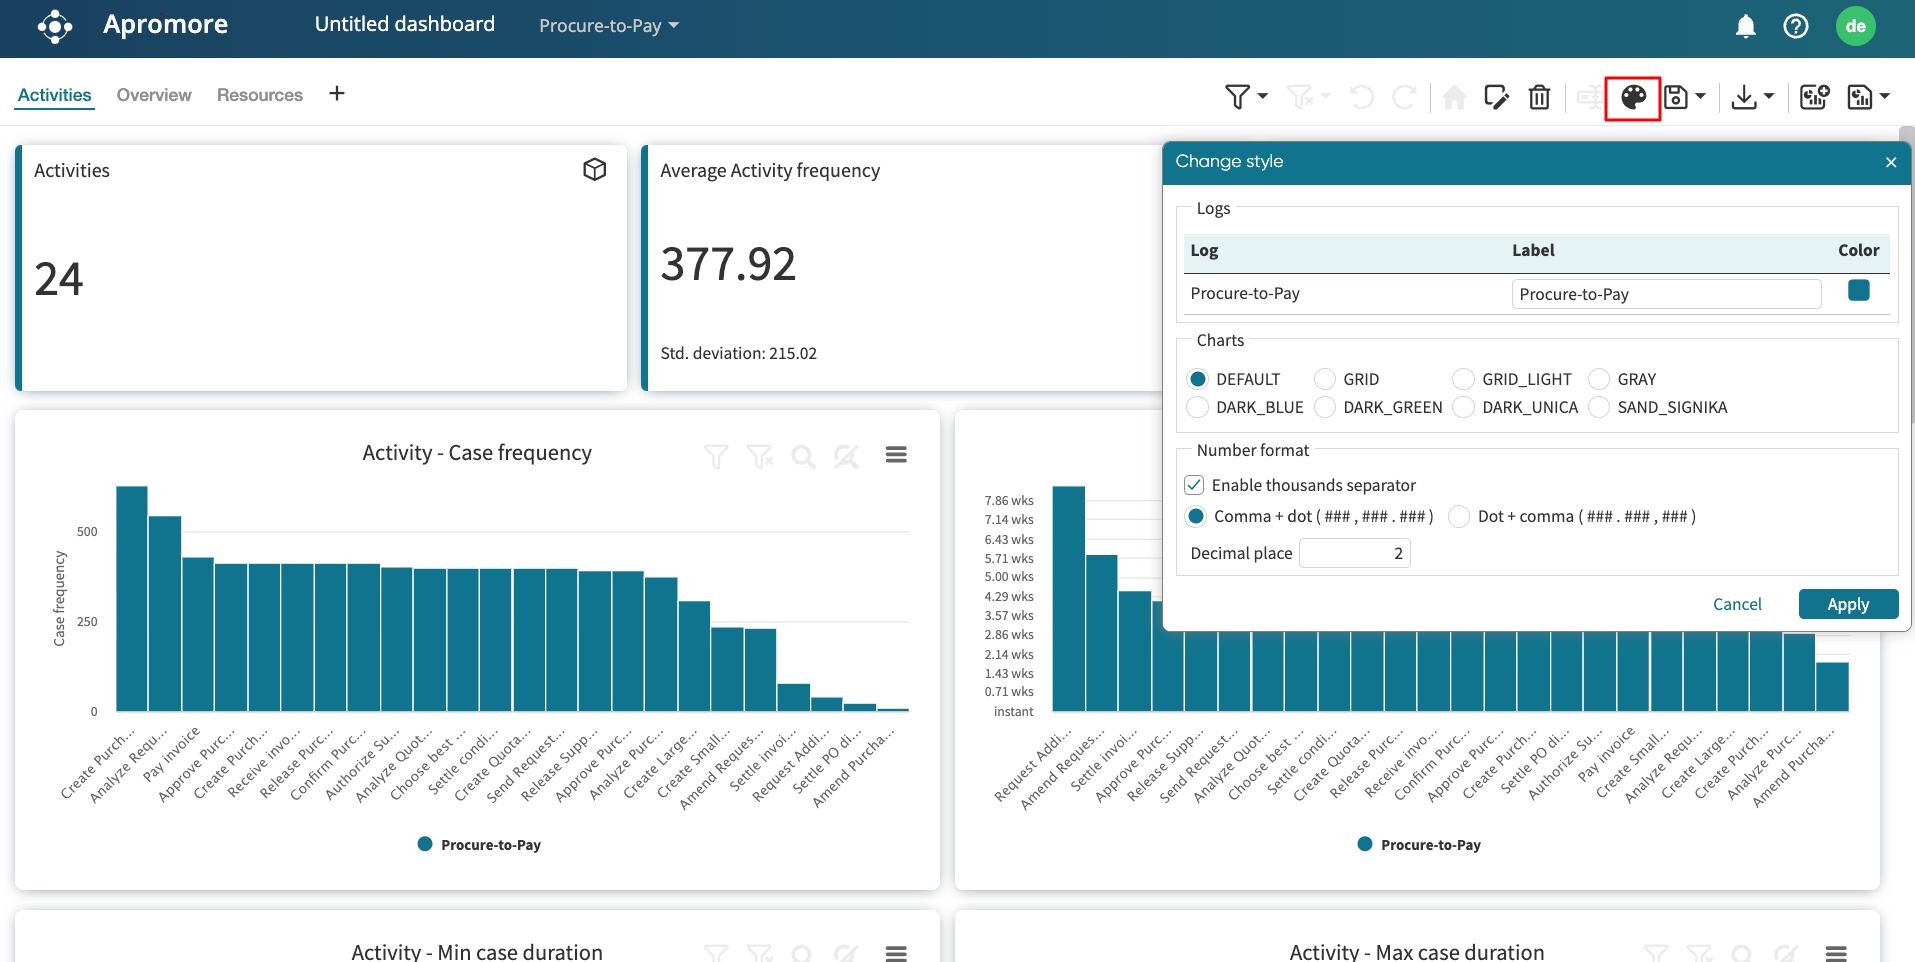
Change the style of dashboard
To change the style of the dashboard, click on the  button and select from different styling options.
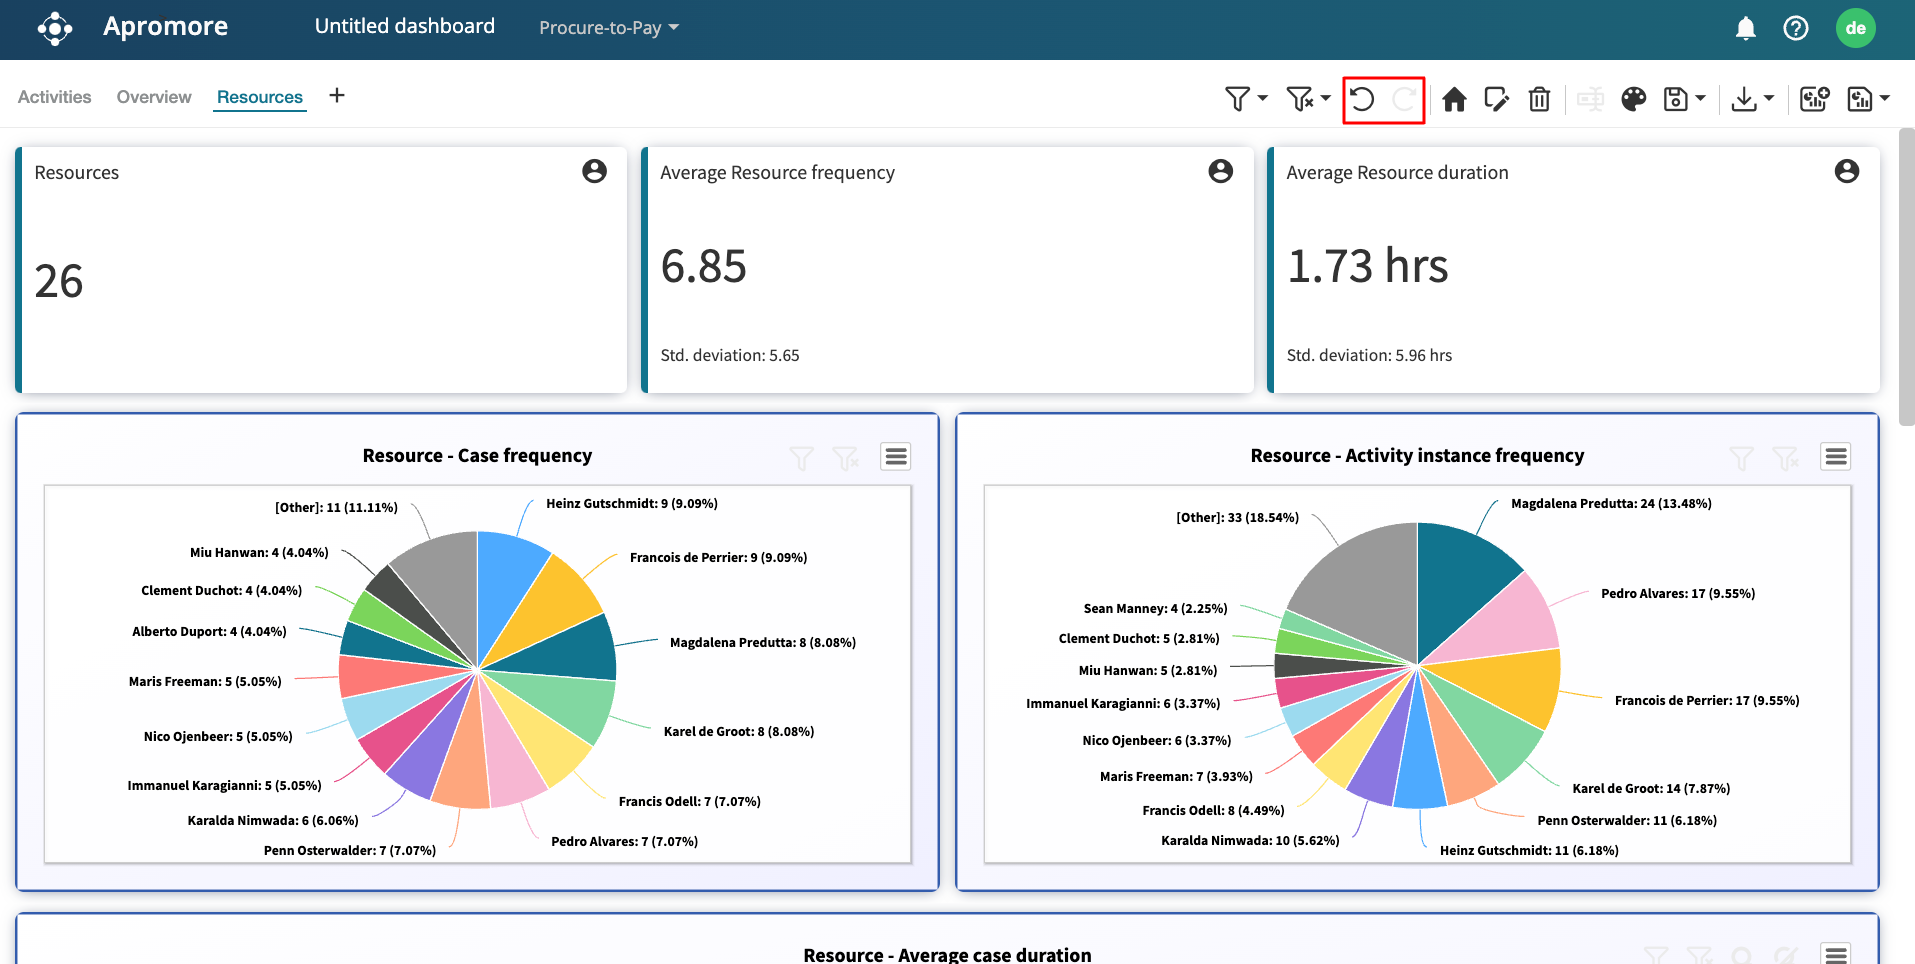
Undo/redo action
In the case of dashboards created from existing views or changes made to an existing default view (Overview, Resources, Activities), we can choose to undo/redo the dashboard actions by clicking on the undo/redo button.