Quick range filters and drill-throughs in Dashboard
We can apply a filter to any chart by selecting a range of values in a dashboard. This allows us to analyze and visualize the filtered cases. There are two ways to apply filter range from the Dashboard: regular filters and quick-range filters.
Regular filters on Dashboards
Regular filters are the native way of applying filters within the Apromore Dashboard. To use regular filters on a Dashboard, first launch the Dashboard from an event log.
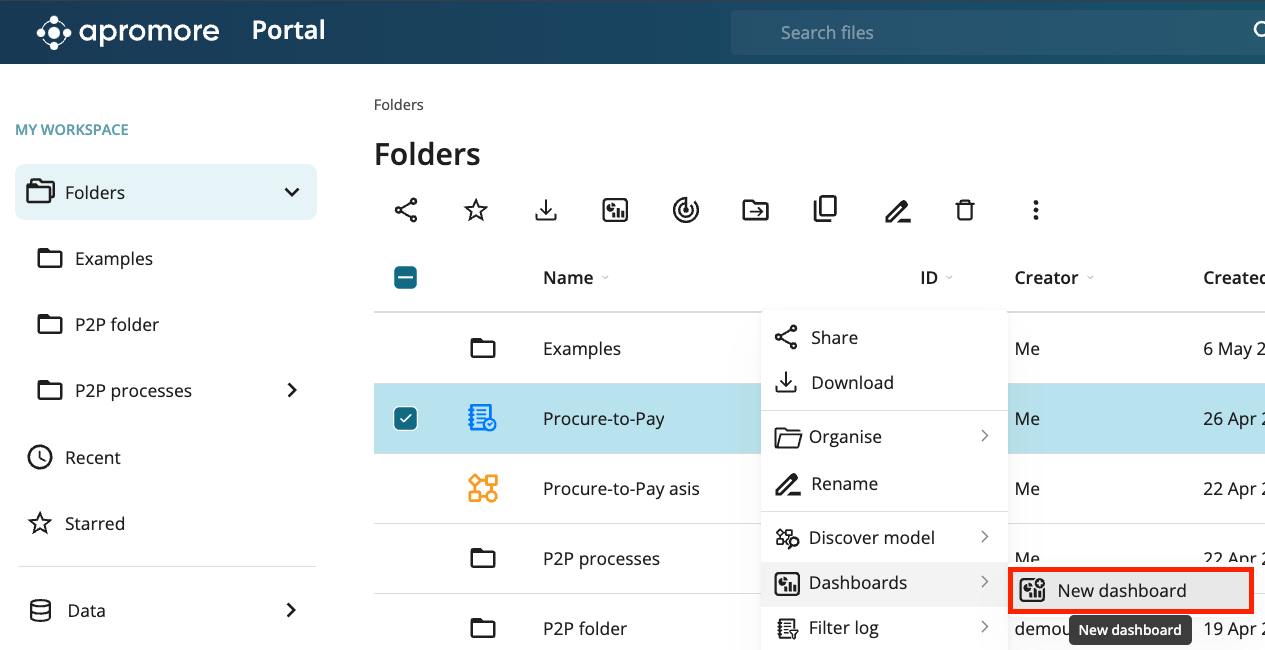
From Apromore Portal, right-click an event log and select Dashboards > New dashboard. If we have an existing dashboard, we can select View dashboards and open the preferred Dashboard.
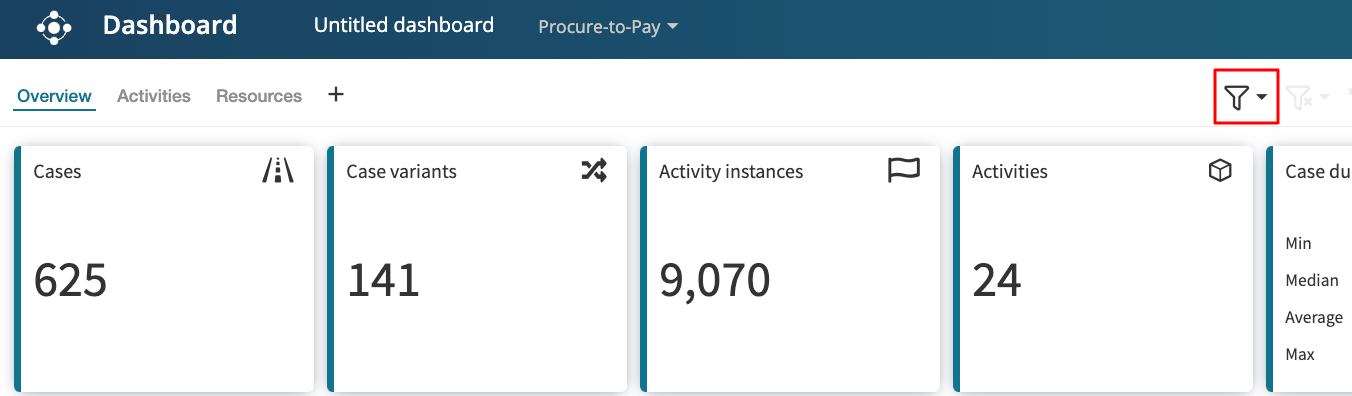
Click the filter icon  in the top-right corner of the Dashboard.
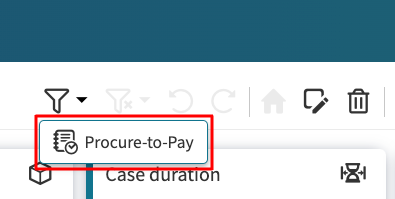
Select the log to filter.
Create and apply a filter. The Dashboard creates visualization based on the filter.
For example, if we wish to filter cases that took more than ten weeks, we can create a Performance filter.
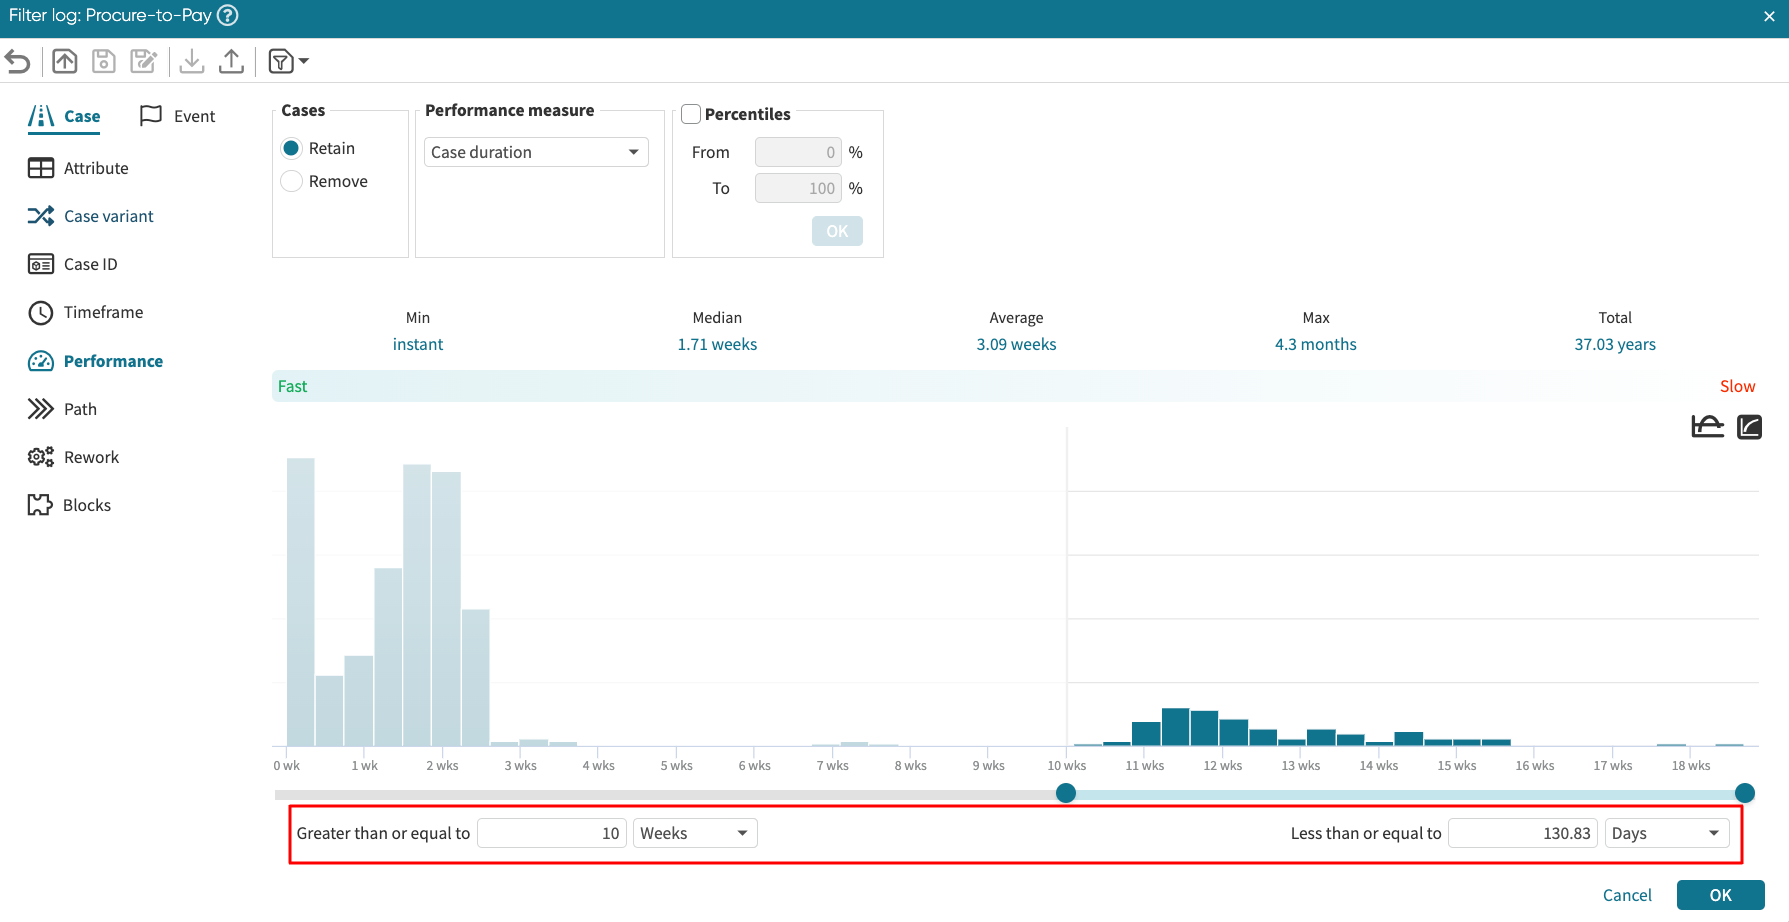
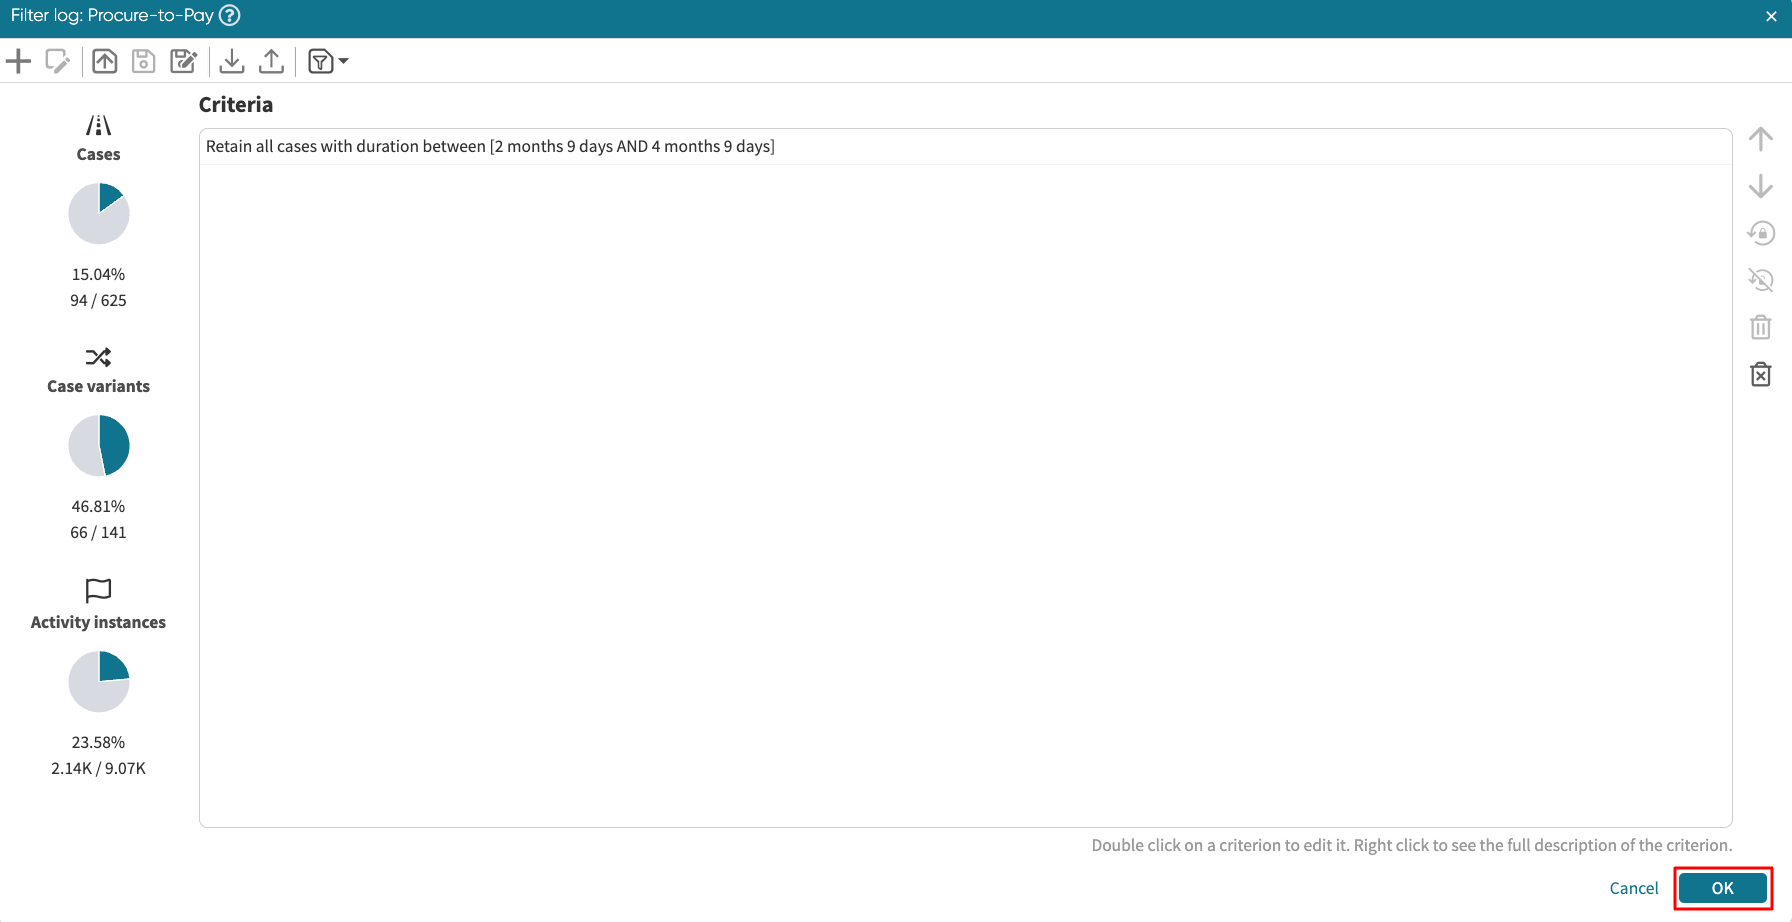
Click OK to apply the filter.
We will be prompted to save the Dashboard and add a description. Click OK.
The filter is successfully applied, and the Dashboard only visualizes cases that satisfy the filter criteria. In our case, it visualizes only cases that took longer than ten weeks.
Note
If the dashboard is not been saved, we’d be prompted to first save the dashboard
Quick range filters
The quick range filter is a more convenient way of applying filters from the Dashboard. To use the quick range filters, we must be in the Apromore Dashboard. From Apromore Portal, right-click an event log and select Dashboards > New dashboard.
To filter the Dashboard based on a range of values, drag the mouse across the visualization we desire.
If, for example, we wish to filter the Dashboard by cases that took longer than two months, navigate to the Case duration visualization.
Drag the mouse across the visualization to select the range we need.
To confirm the range was successfully selected, the unselected part is greyed out.
Click the filter icon .
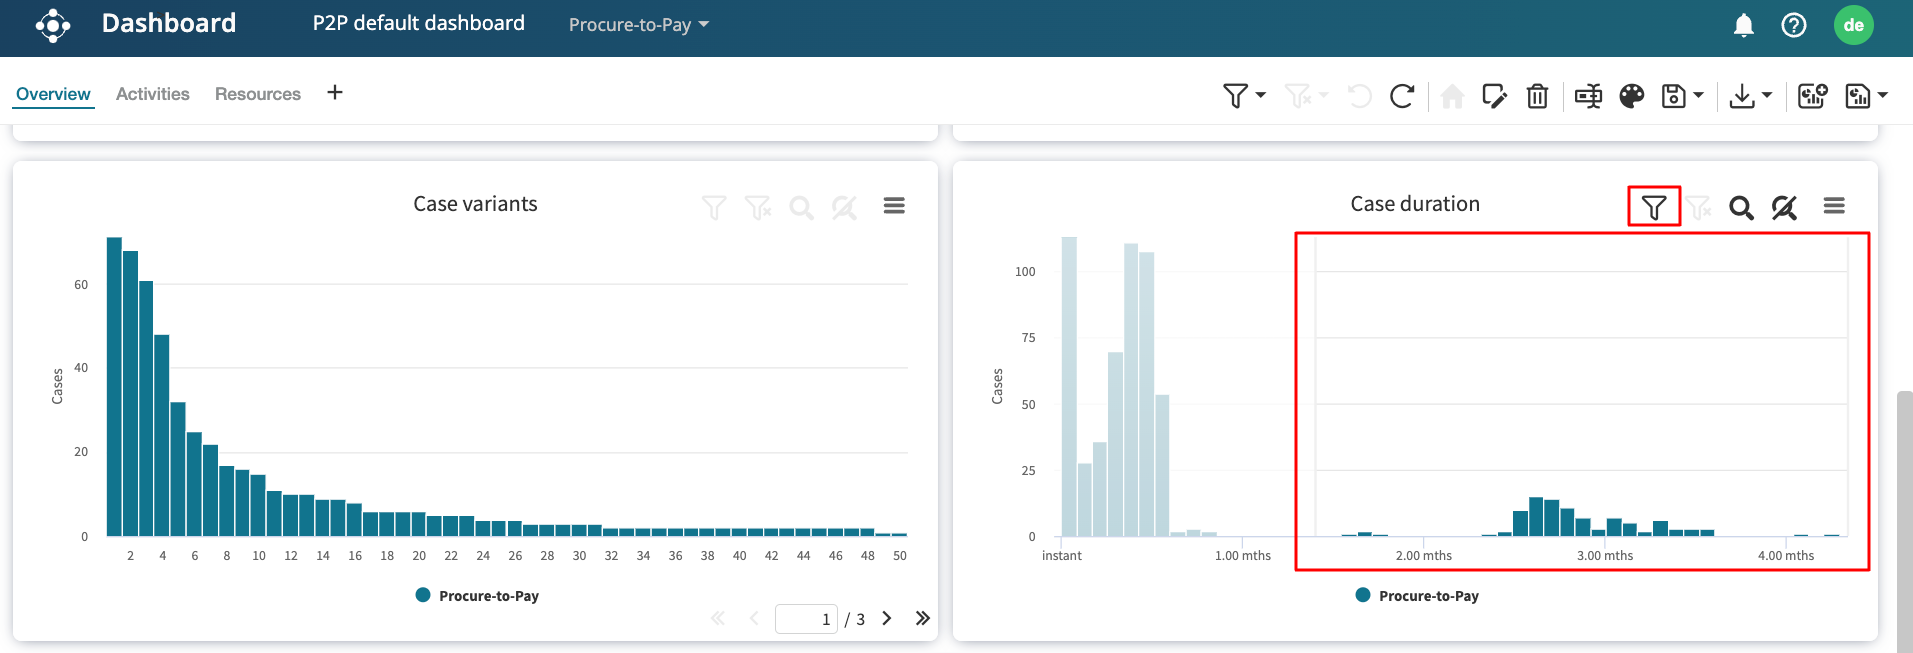
This applies the filter to the Dashboard.
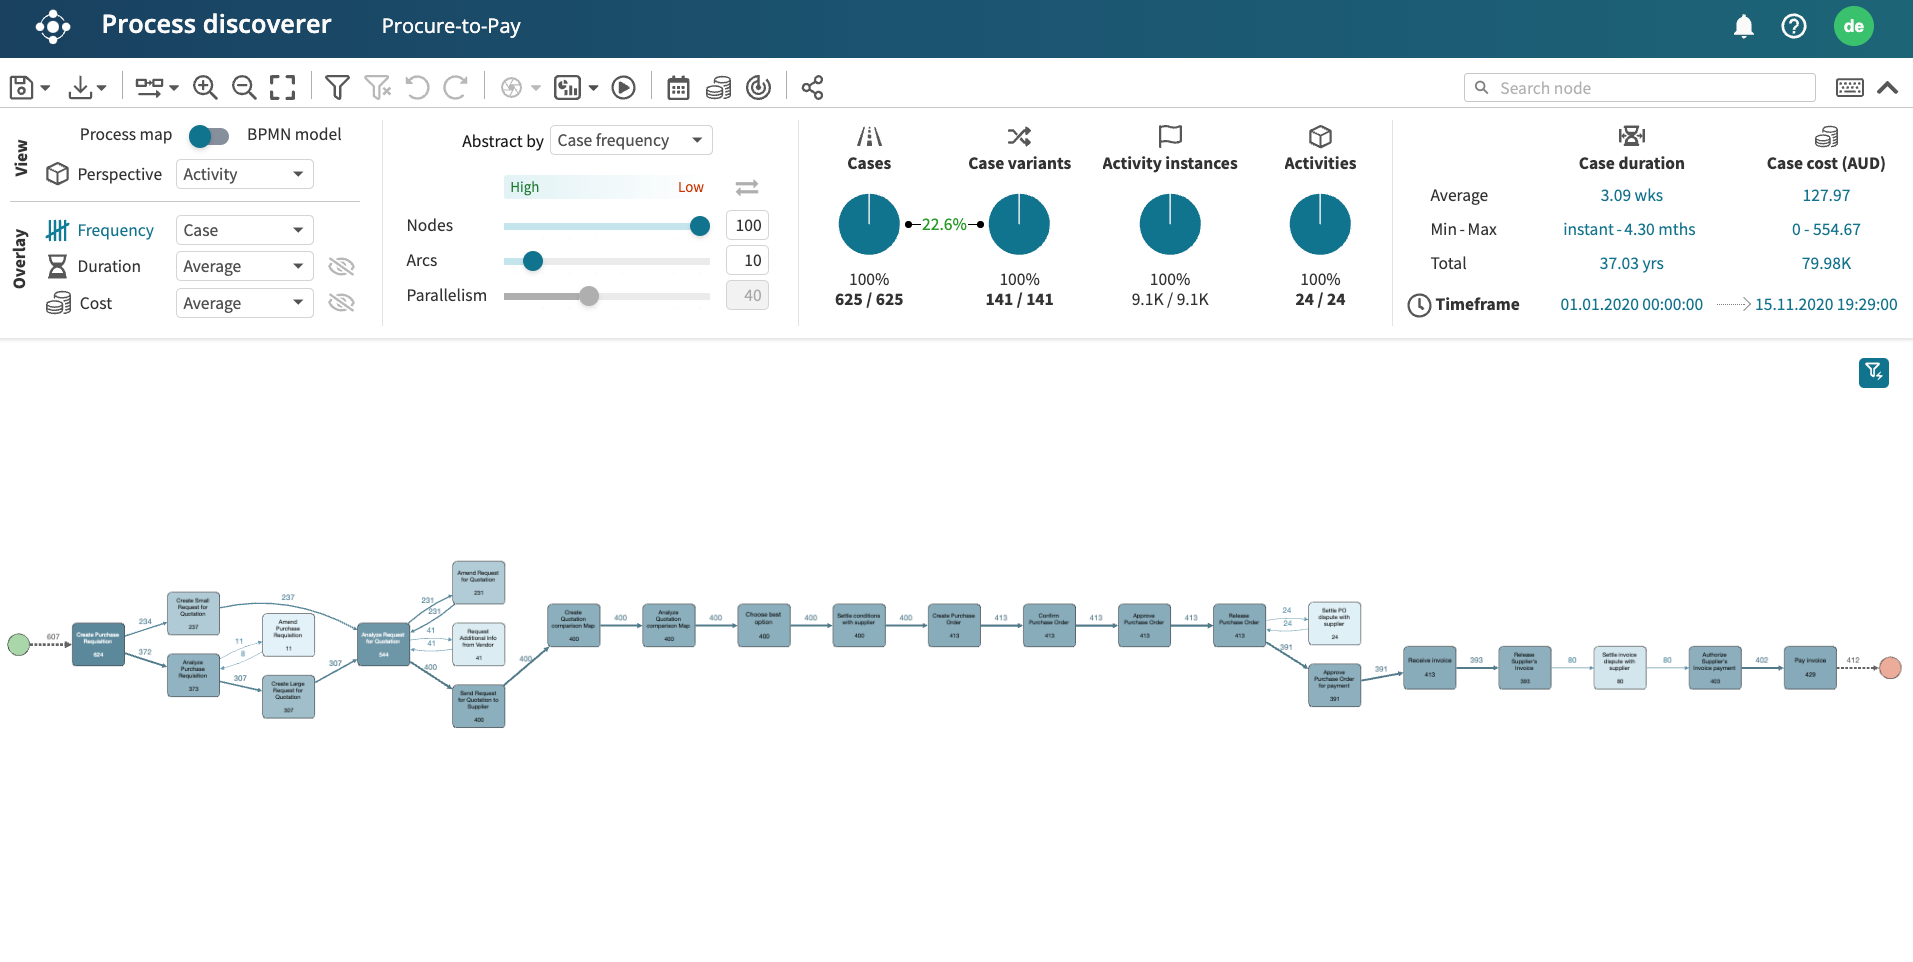
Drill-through from a Dashboard to Process discoverer
When we apply a filter to a Dashboard we can discover the process map or model with Process discoverer. Apromore allows us to drill through from a Dashboard to Process discoverer while maintaining the applied filter. To do this, click on the name of the event log in the top left corner. Click Discover process.
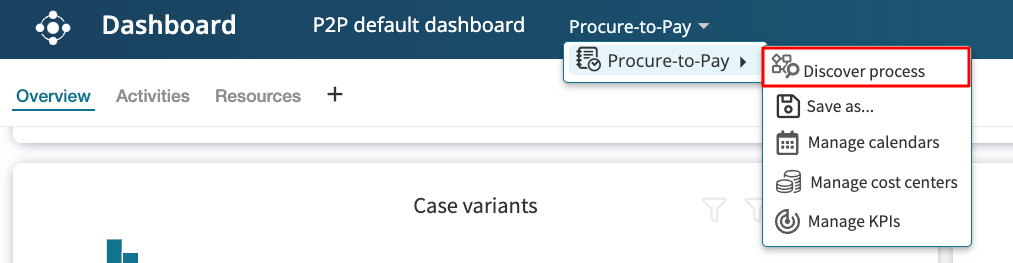
This launches Process Discoverer, where we can perform a more granular analysis of the filtered process.