Add KPIs to dashboard
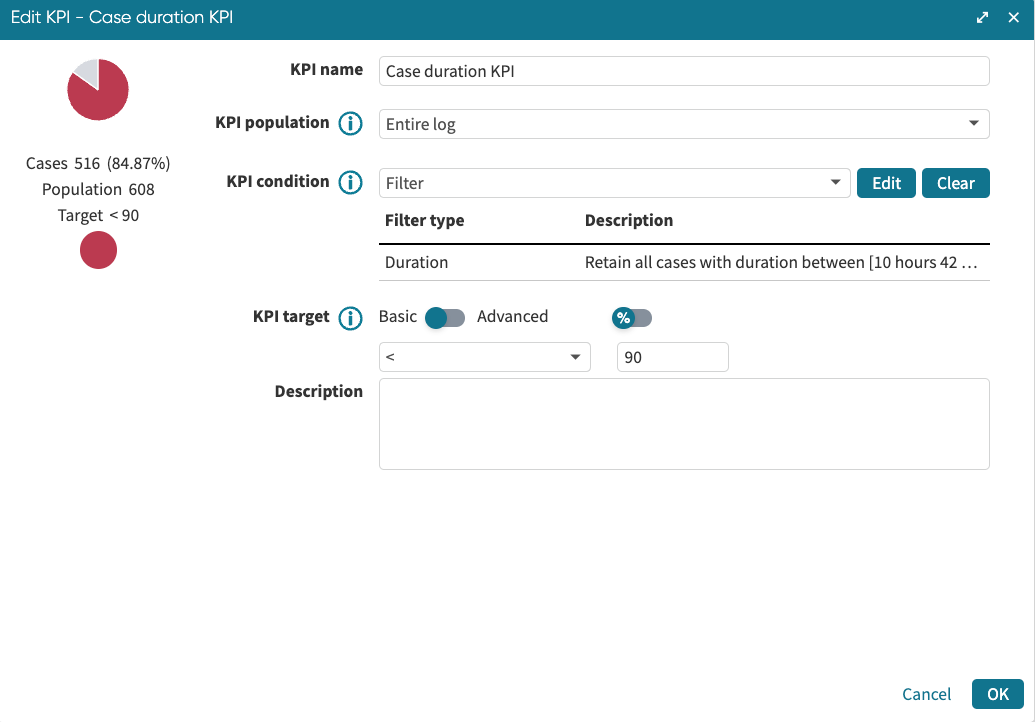
After defining a KPI on a log, we can add a gauge to display the result of the KPI in a dashboard. For example, we can add a KPI to a dashboard that flags red when the percentage of cases that take more than four weeks exceeds 10 percent. To achieve this, click the event log in Portal and create the KPI.
Add the KPI to the log.
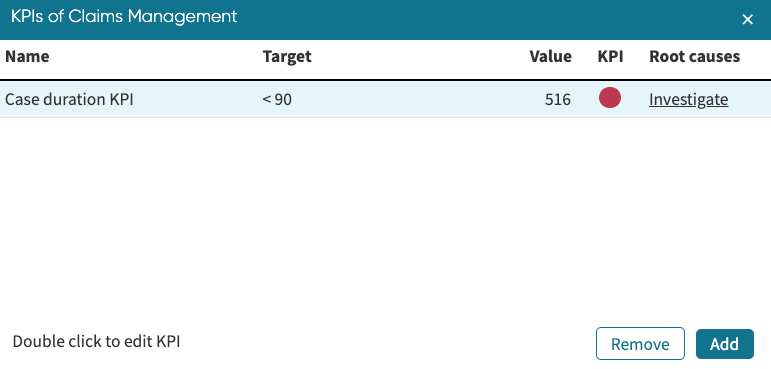
After successfully adding the KPI to the log, open a dashboard from the log.
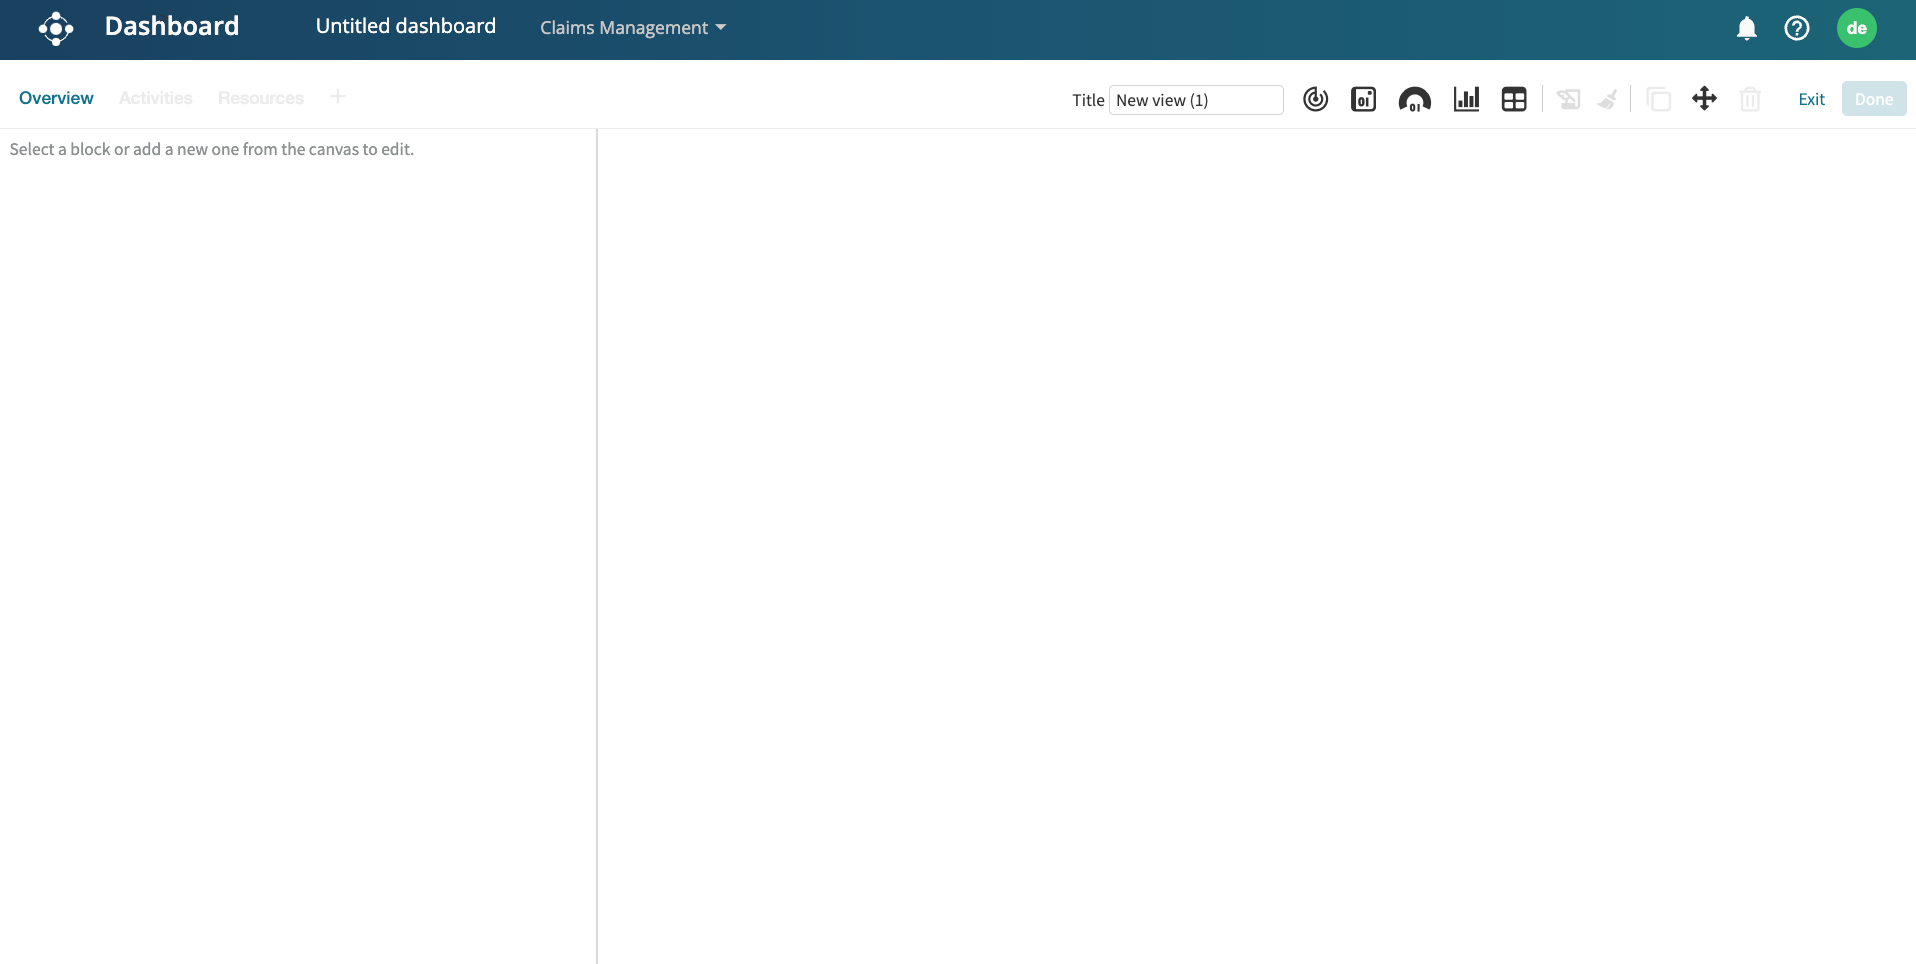
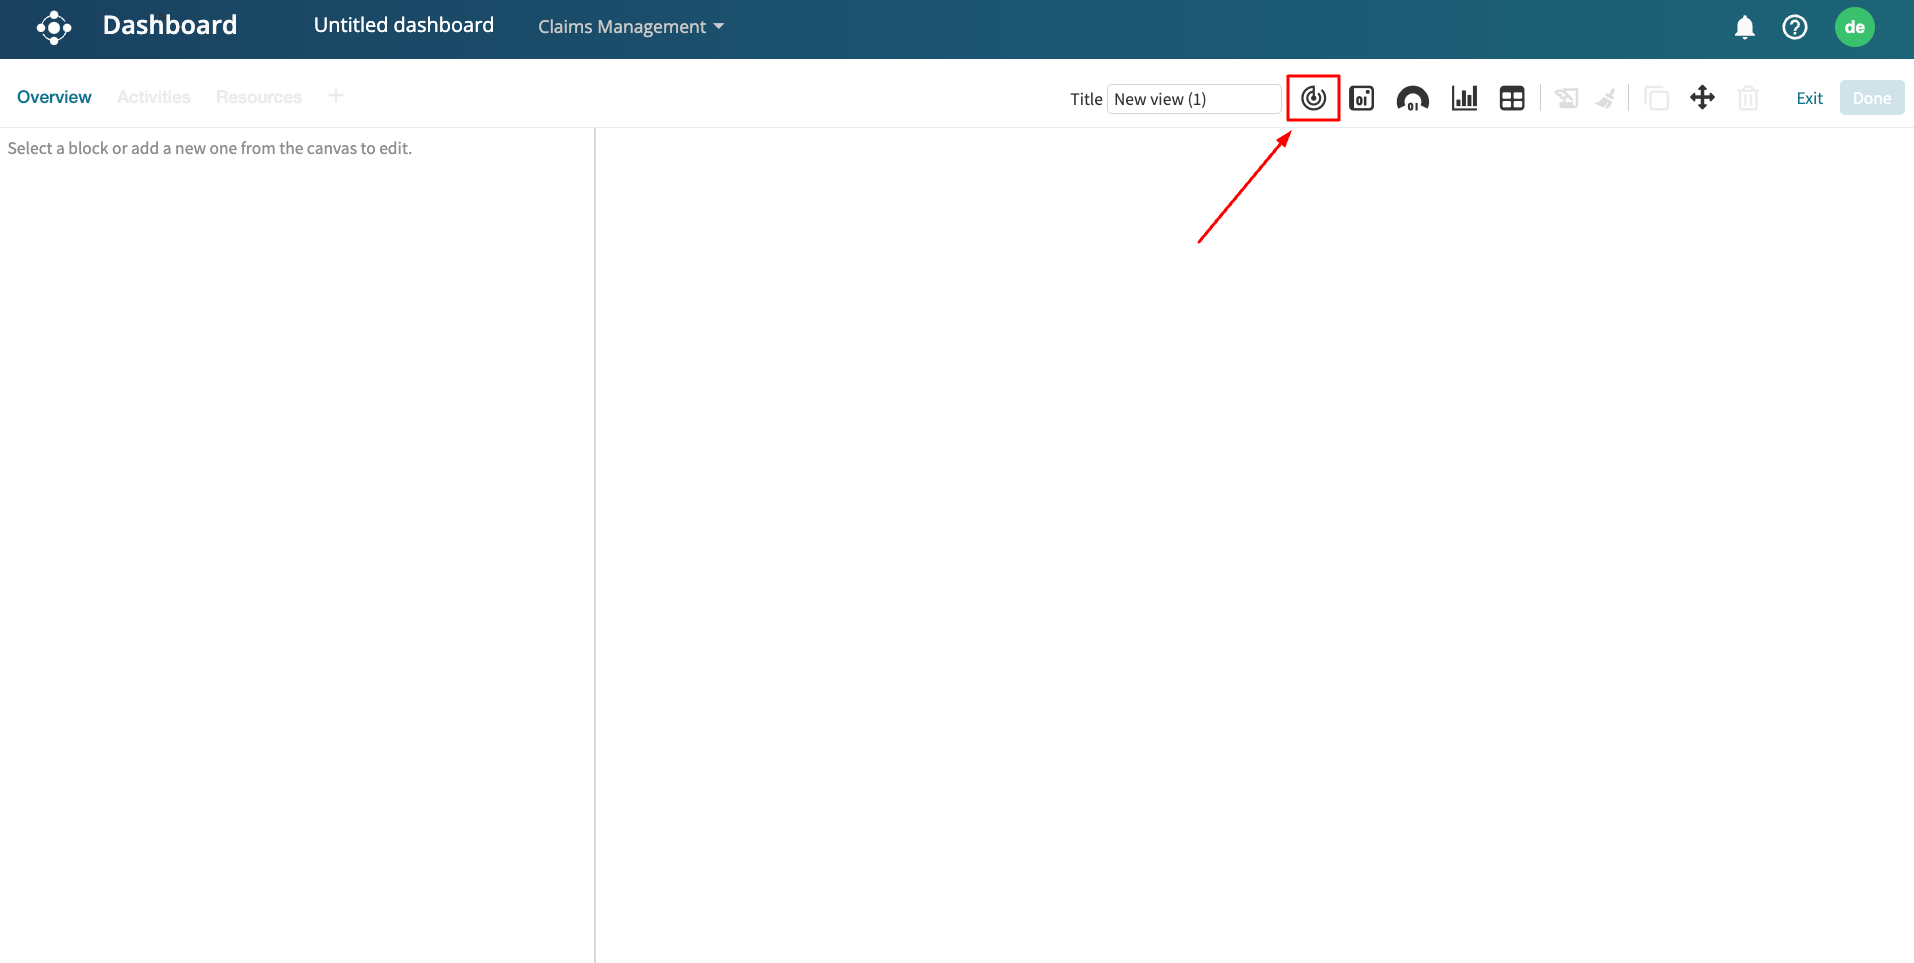
Click the Add KPI icon to add the KPI.
A tile is created showing the value and the fulfillment of the KPI associated with the log.
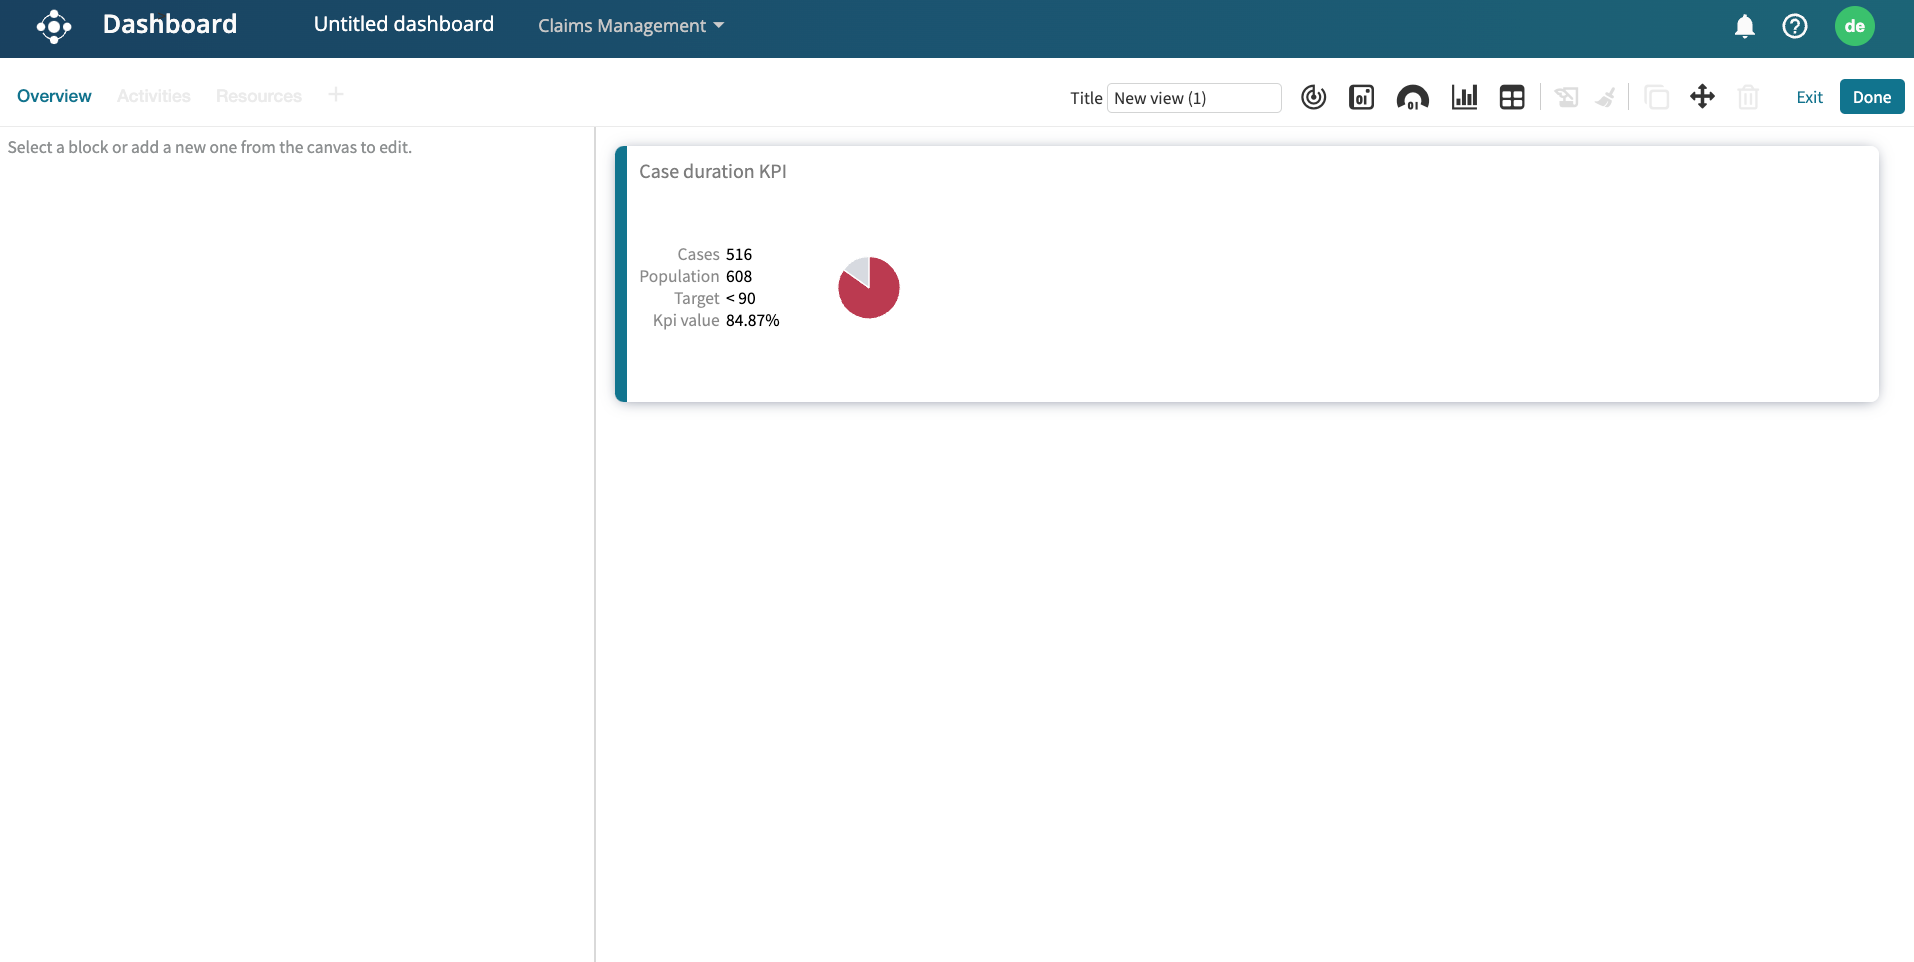
Click the tile to edit it. If multiple KPIs are associated with a log, we can click the KPI drop-down to select the KPI to display.
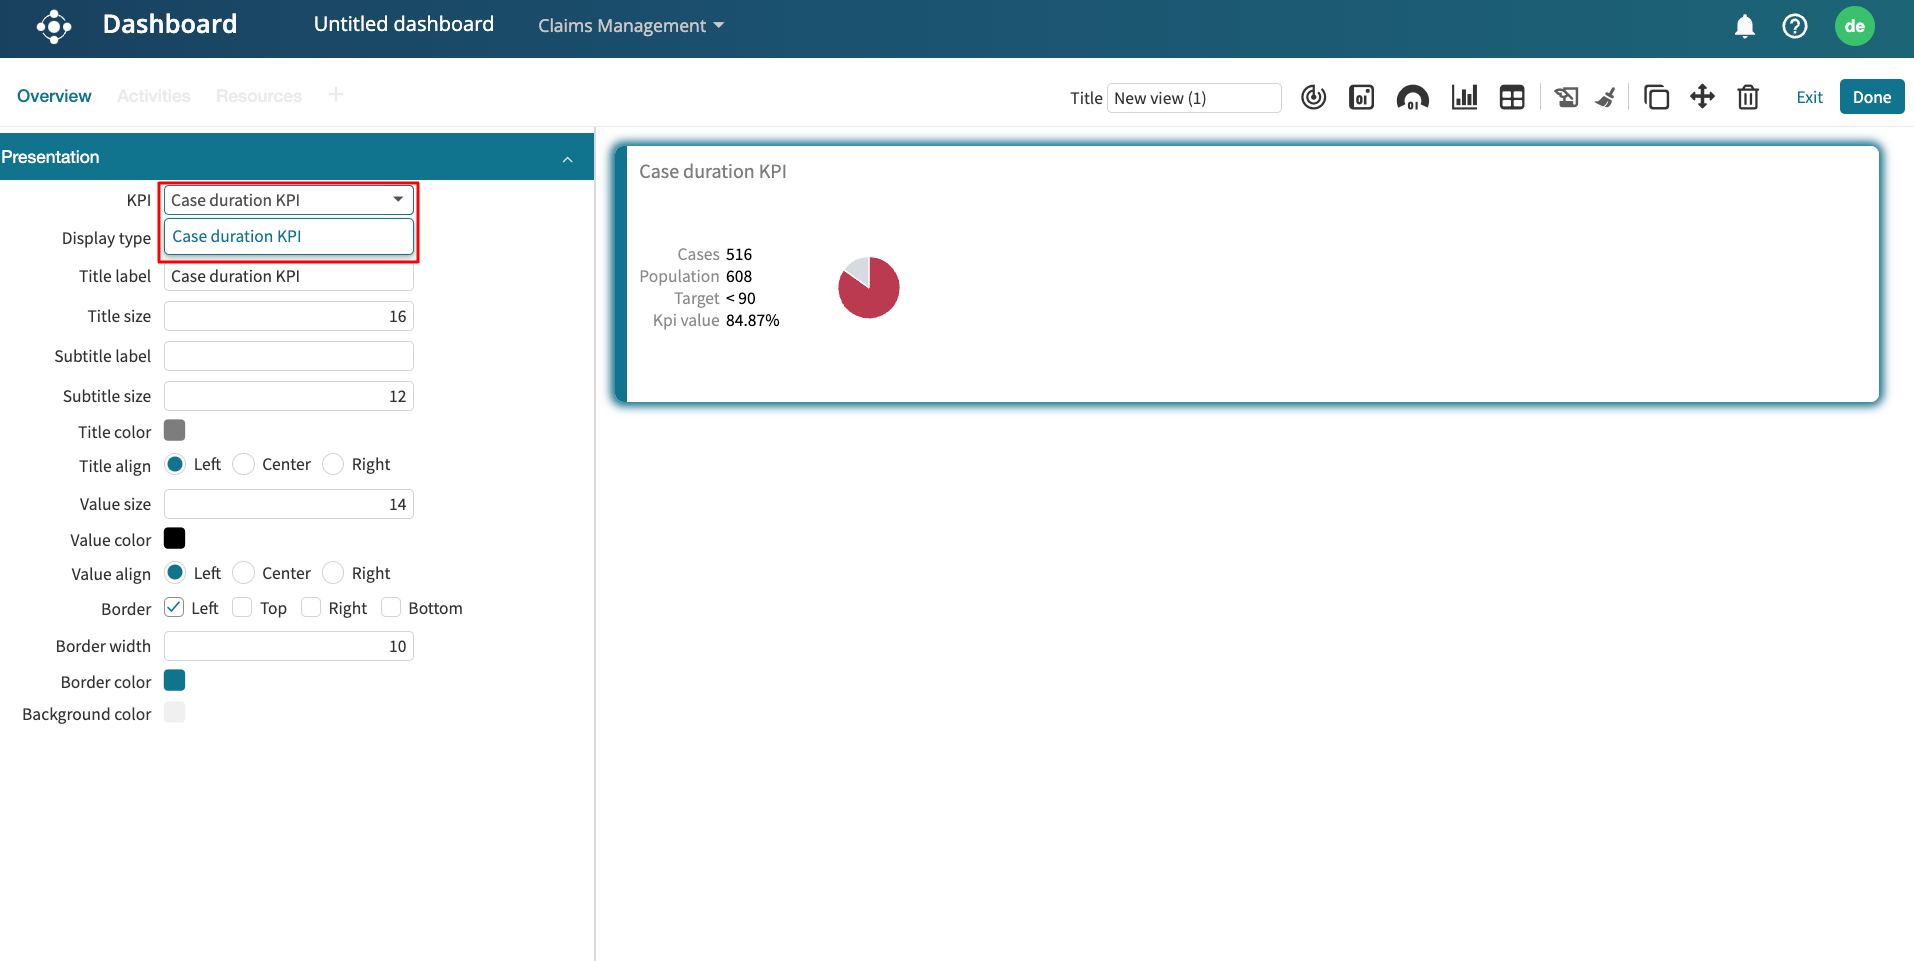
By default, the KPI is displayed as a pie. We can, however, change the KPI to be displayed as a gauge by selecting the Gauge Display type.
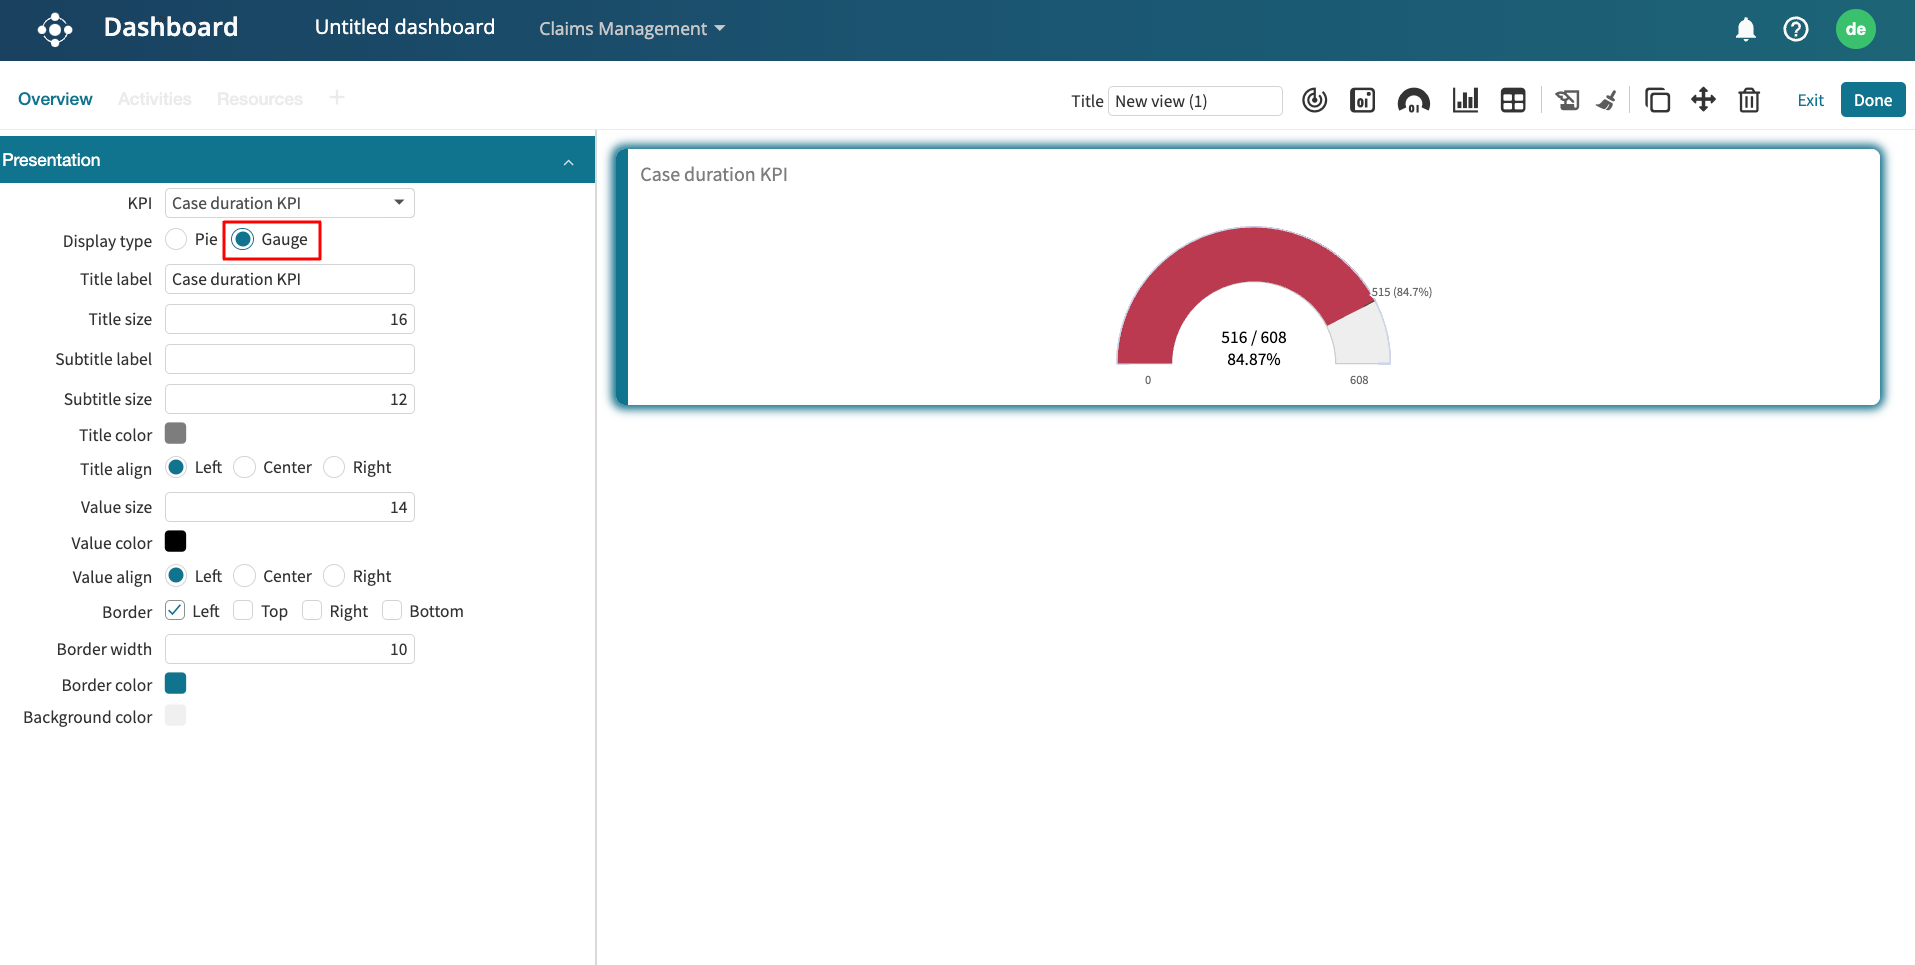
The KPI appears red because we have selected a KPI target of <10%. However, 15% of cases had a case duration greater than four weeks.