Add tiles to dashboard
We can add a tile in a Dashboard view to display:
A metric calculated over the entire log, such as the number of cases in the event log, the number of case variants, the average processing time, etc.
A statistic of an event log attribute, such as the number of unique values of an attribute (e.g., the number of unique activities, number of unique resources, roles, etc.) or the sum of the values of a case attribute (e.g., the sum of the Amount attribute over the cases in the log).
A statistic over the handovers between consecutive values of an event attribute, e.g., a statistic of the handovers between Resources or Roles.
Metric tile
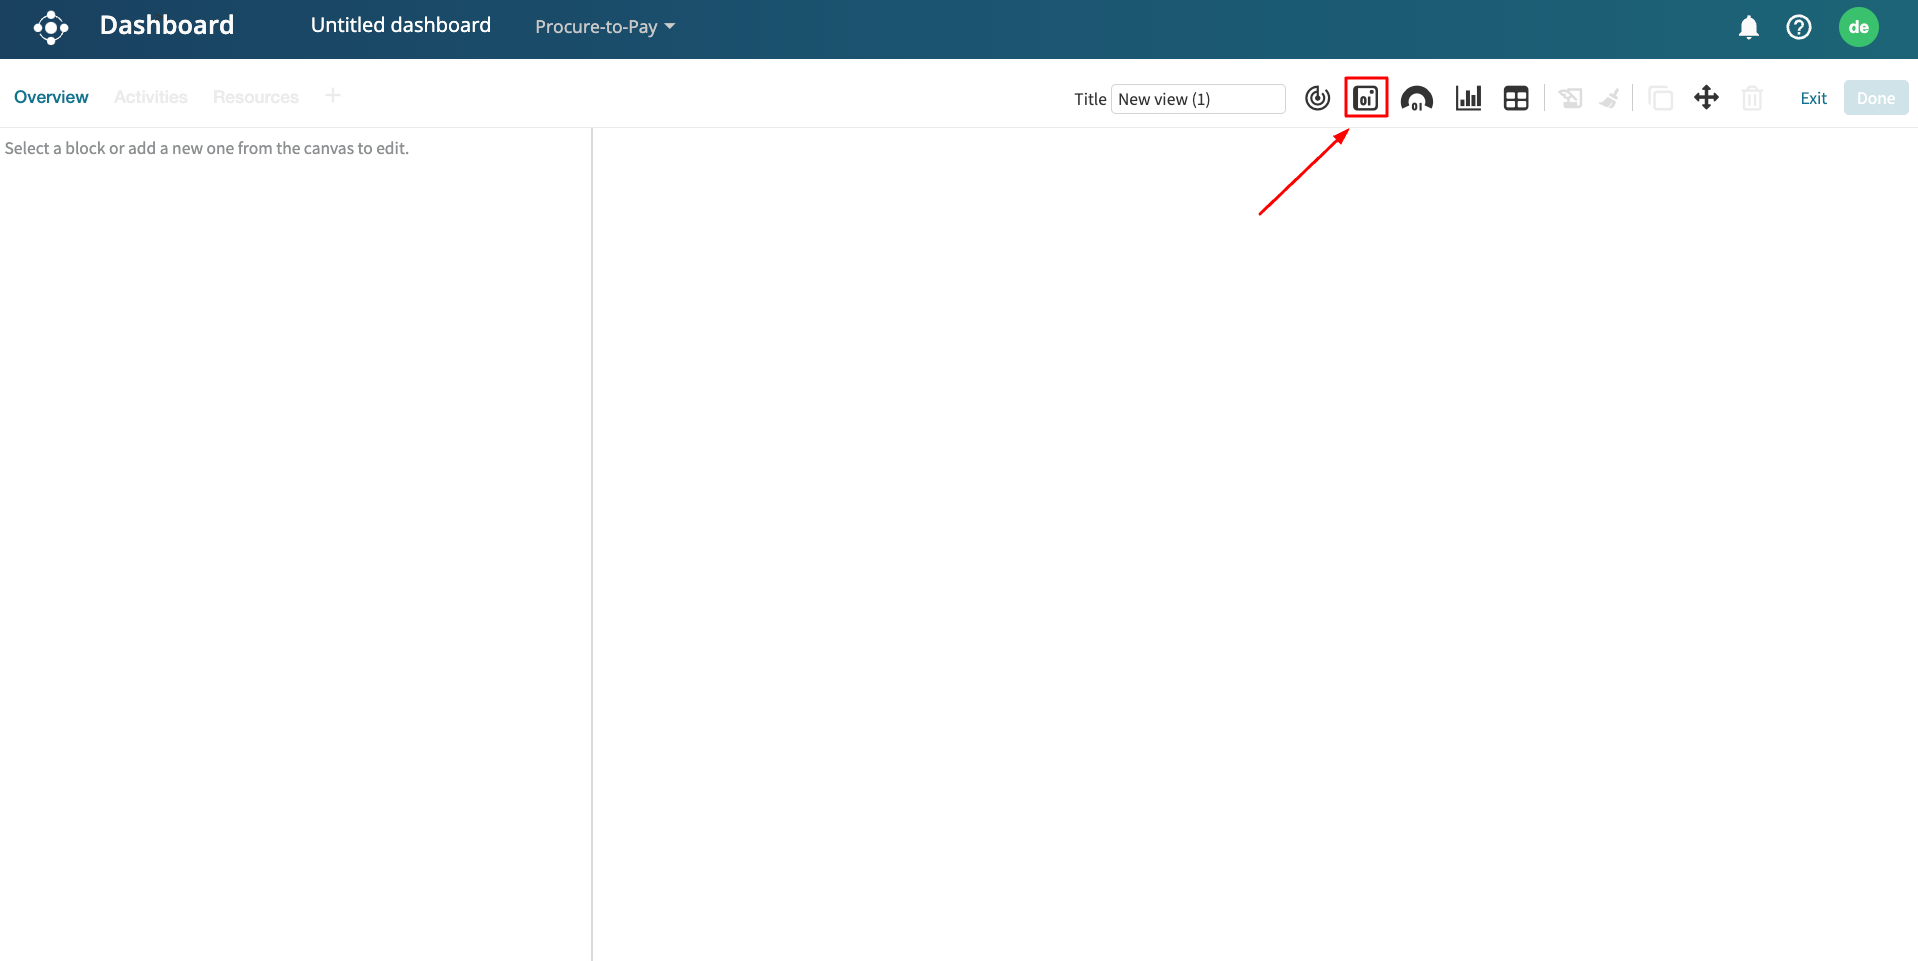
To add a metrics tile in Dashboard, launch a dashboard and create a new dashboard. Click the Add new tile icon to add a tile.
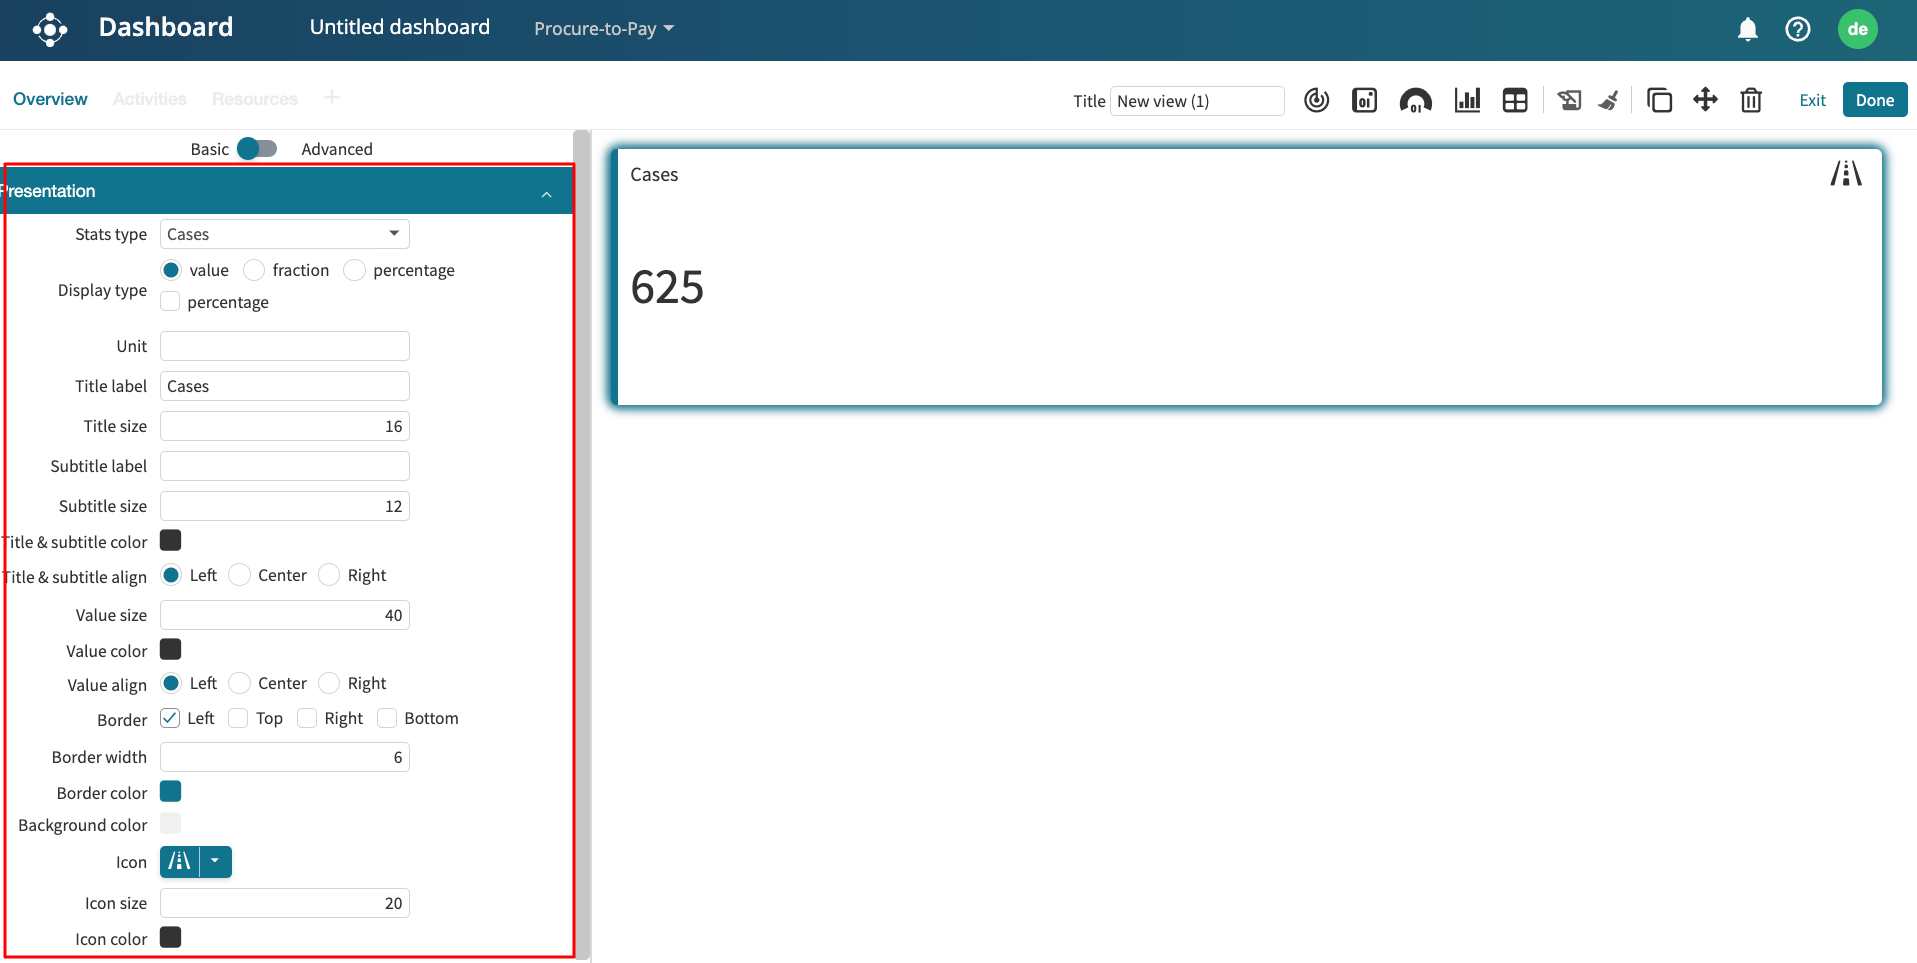
The tile displaying the number of cases is added. We can change the metric to display by clicking the tile. The Presentation setting appears in the left pane.
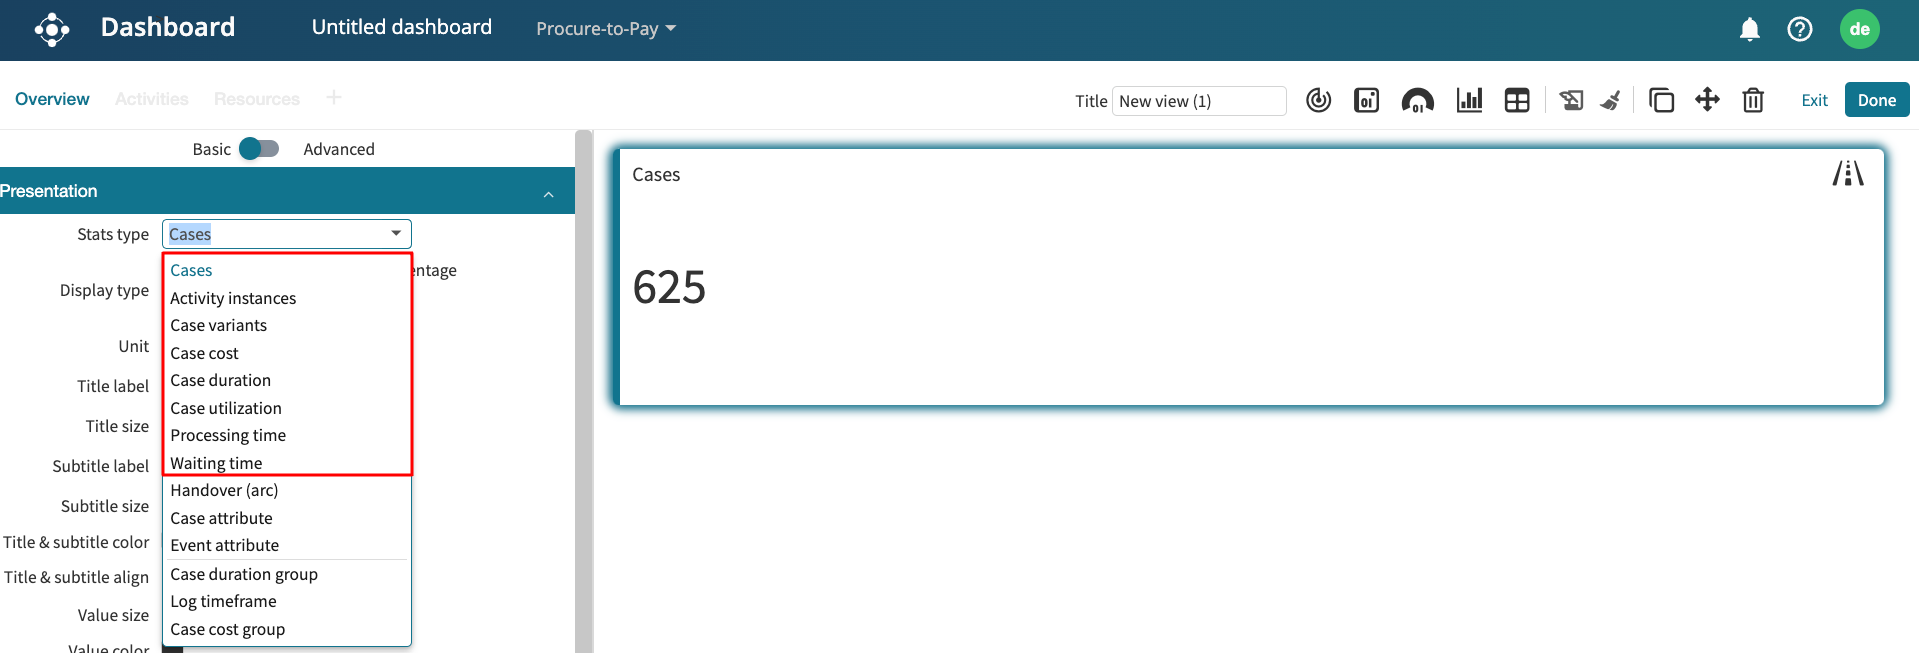
We can add the following metric to a tile:
Cases.
Activity instances.
Case variants.
Case cost.
Case duration.
Case utilization.
Processing time.
Waiting time.
Case duration group.
Log timeframe.
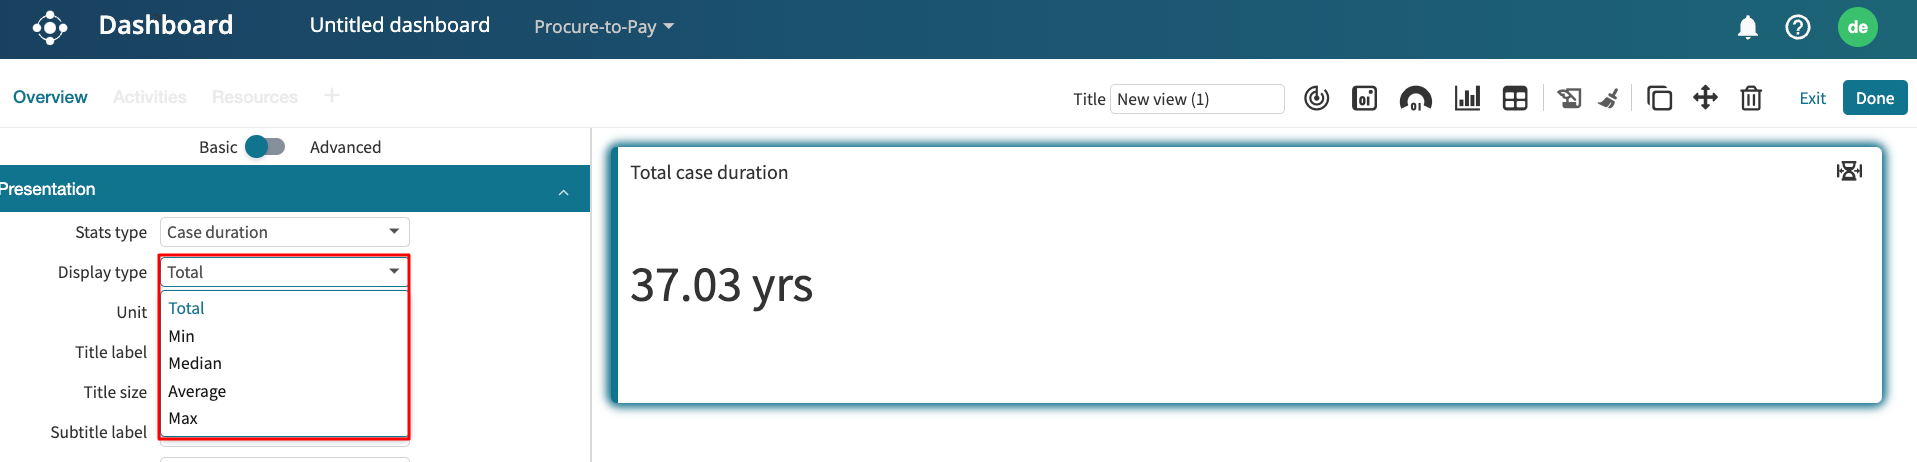
When we select a metric, the Display type may appear in the options where we are required to choose the aggregation function to be displayed, such as Total, Min, Median, Average, or Max.
Attribute statistics tile
We can add a tile that displays an aggregate statistic over the values of an attribute in the log. The attribute can be a case attribute or an event attribute.
If the attribute is of type String, e.g., the activity attribute, the available aggregation functions are:
Min/Median/Average/Max frequency.
Total/Min/Median/Average/Max duration.
If the attribute is of type Integer or Real, e.g., the claim value, the available aggregation functions are:
Sum (inter-cases).
Min/Median/Average/Max value.
Total/Min/Median/Average/Max duration.
Event attributes additionally have the following aggregation functions:
Total unique values.
Min/Median/Average/Max unique values per case.
Unique values summary.
Case attributes additionally have the “Unique values” aggregation function.
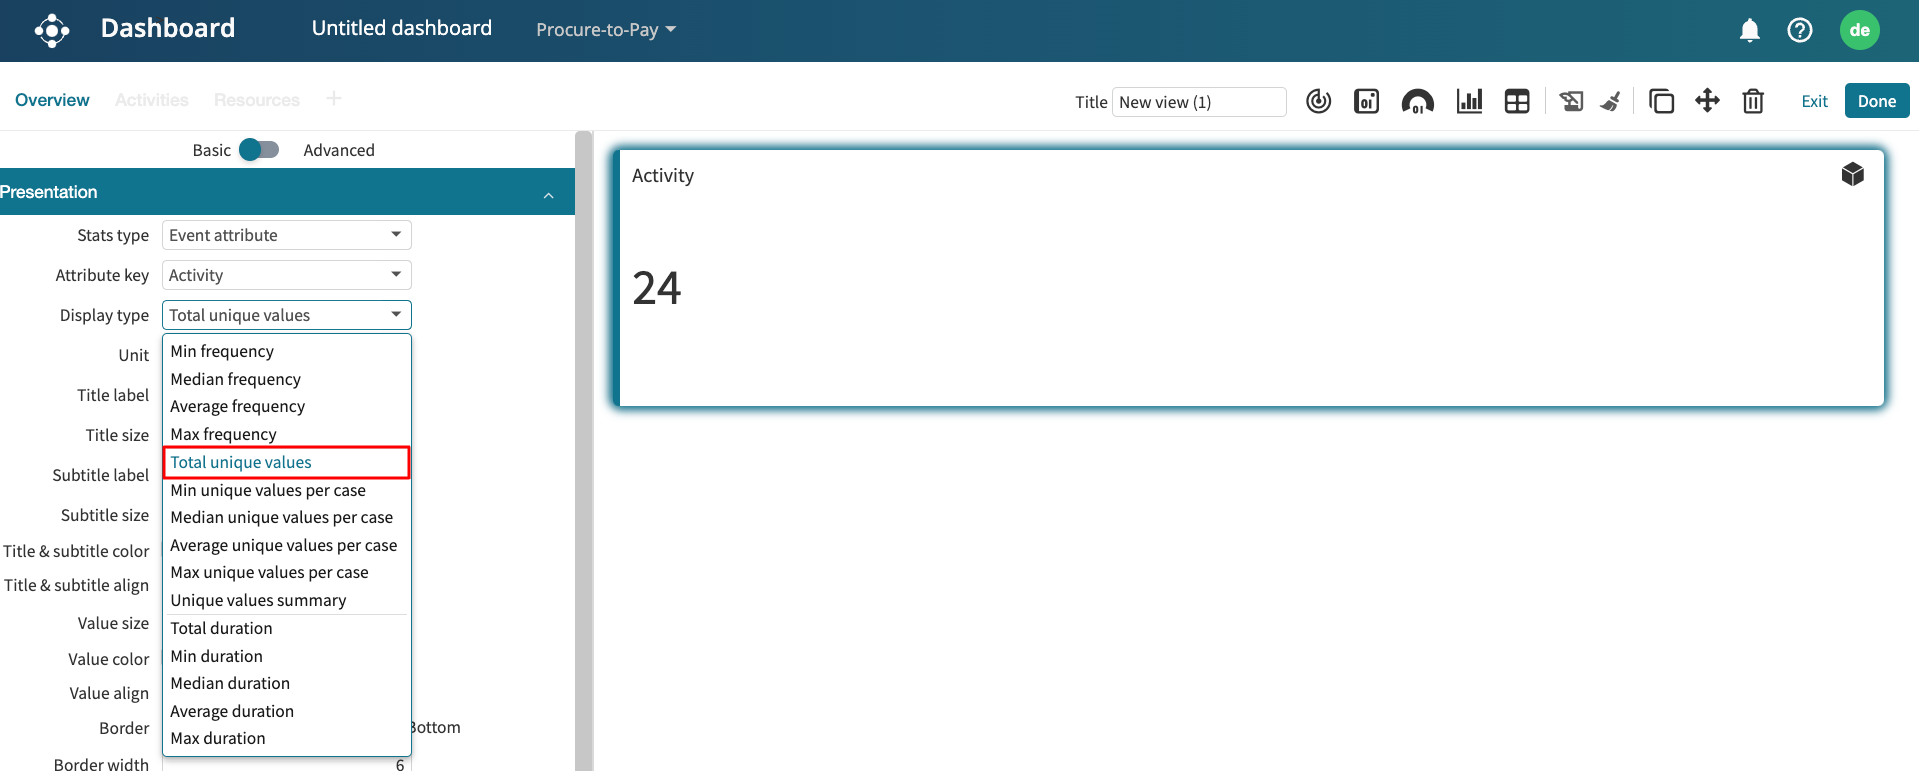
We can add a tile that displays the total unique activity in the Claims Handling log. In Stats type, select “Event attribute”. Select “Activity” as the Attribute key. In Display type, select “Total unique values”.
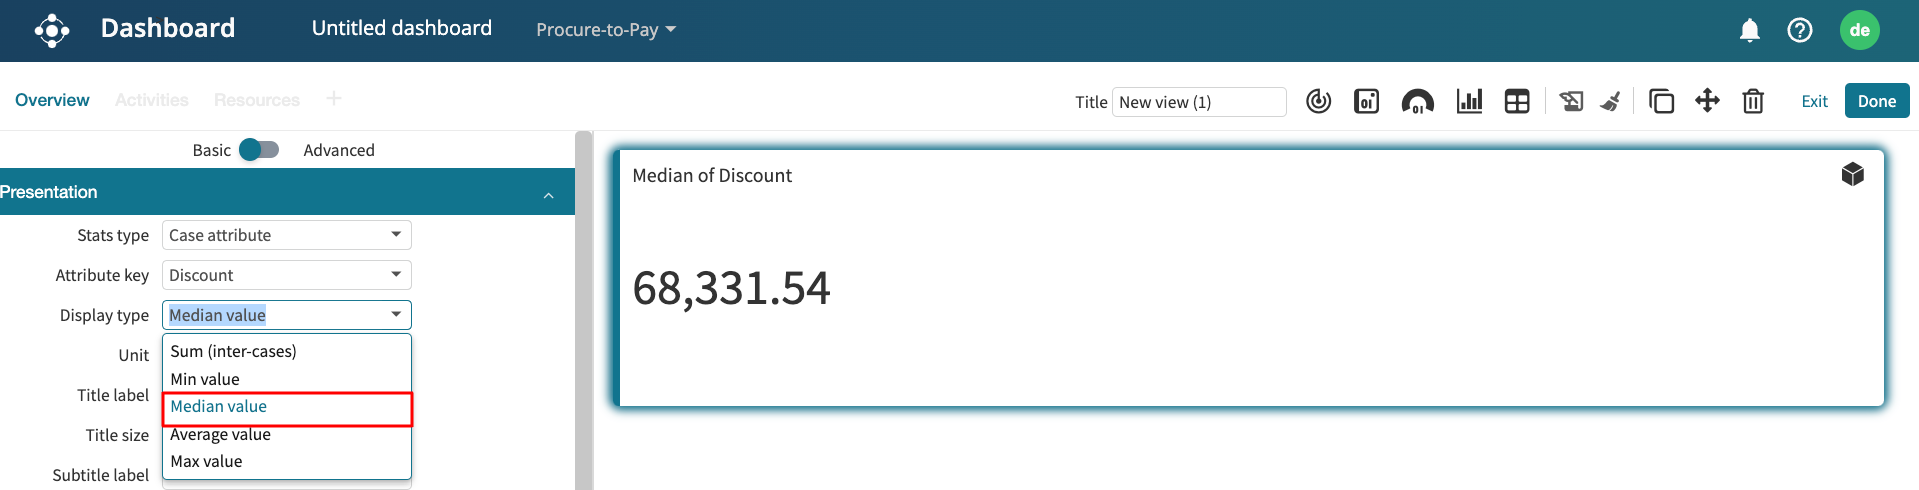
We can also add a tile displaying the minimum claim value in the log. Select “Case attribute” as the Stats type. In the Attribute key, select “Discount”. In Display type, select “Median value”.
Handover statistics tile
During performance monitoring, managers may need to understand how efficiently tasks are transferred from one resource, role, or team to the other.
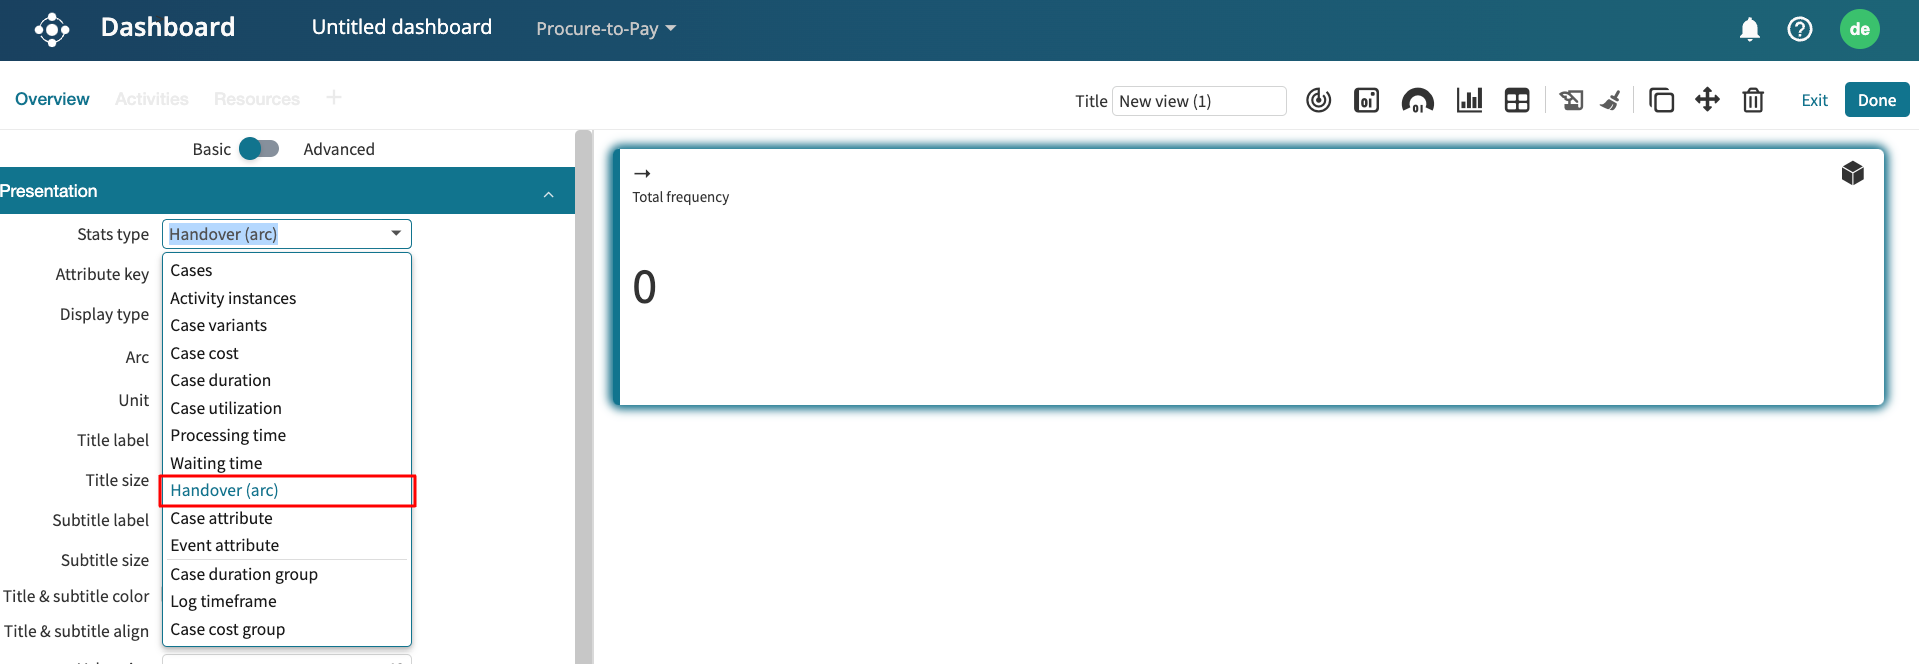
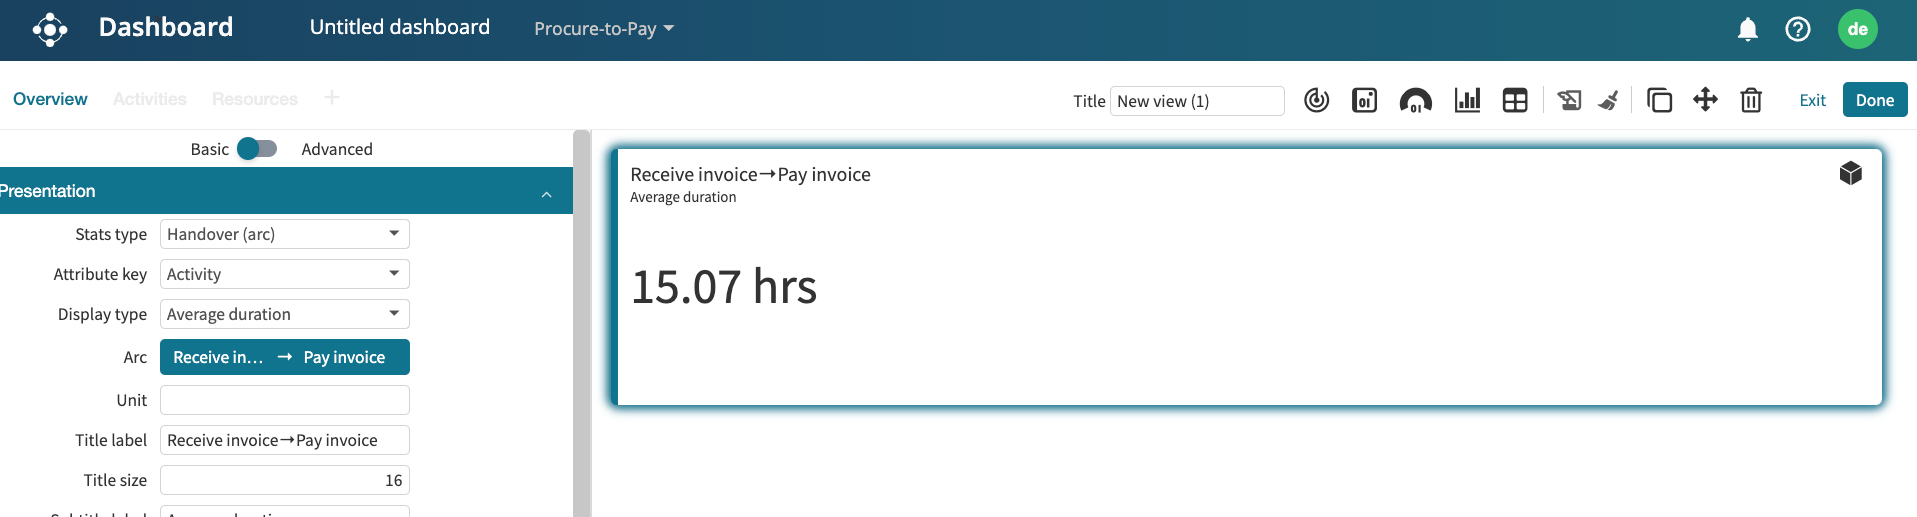
We can visualize the handover statistics in a dashboard tile. For example, we can display the average duration of the arc “Receive invoice” and “Pay invoice”. To do this, open a dashboard and add a new tile. Click on the tile to edit it. In the Stats type dropdown, select Handover (arc).
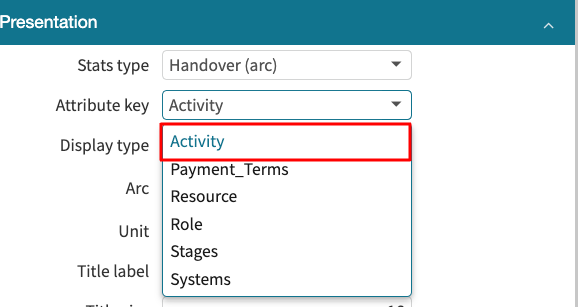
In the Attribute key dropdown, select the event attribute whose statistics will be displayed.
Note
The event attributes in the log determine the attribute displayed in the dropdown.
In our case, we select Activity.
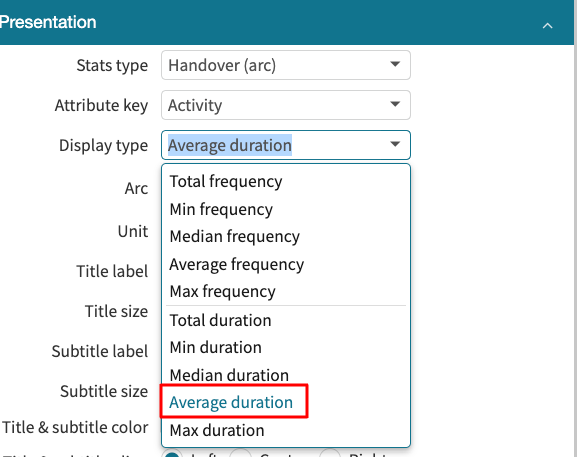
From the Display type dropdown, select the aggregator we wish to perform. We can select the total, minimum, median, average, or maximum frequency or the total, minimum, median, average, or maximum duration.
In our case, we select Average duration.
Specify the arc. The arc represents the source node and the target node. Click Option → Option.
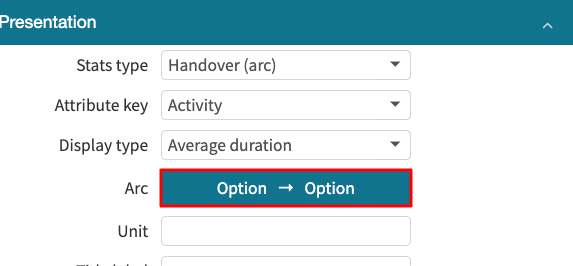
A new window appears to select the source and target nodes. By default, the source node is selected first.
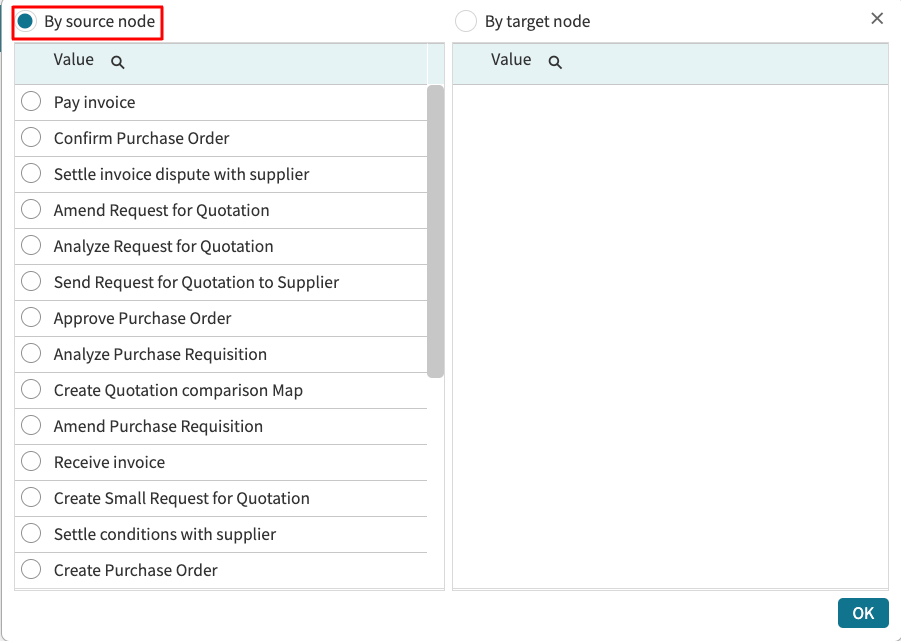
Select “Register Claim” as the source node. Apromore displays a list of possible target nodes from the source node.
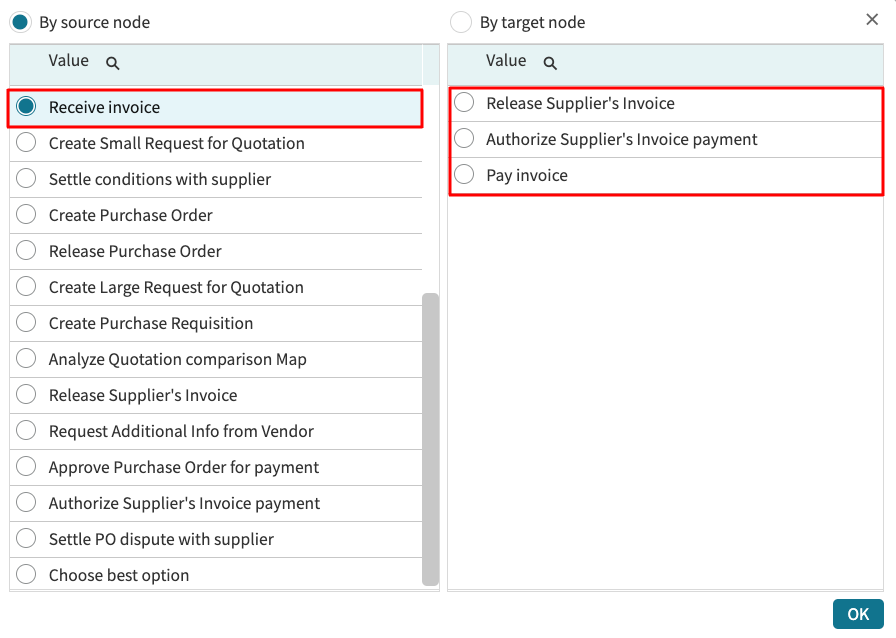
Select “Pay invoice” from the list of values.
Click OK. The tile now displays the average duration between “Receive invoice” and “Pay invoice”.
Note
If we specify the target node first, Apromore displays a list of possible source nodes to the specified target node.