View dashboards
Apromore’s Dashboard allows users to visually analyze a business process from a performance measurement perspective. The dashboard displays a variety of key aggregate statistics and charts on one page. It also allows us to analyze and display the highlights of a process or to compare multiple process variants. For example, we can use the dashboard to compare how a given process is executed across multiple regions or compare the variant of a process consisting of slow cases versus faster cases.
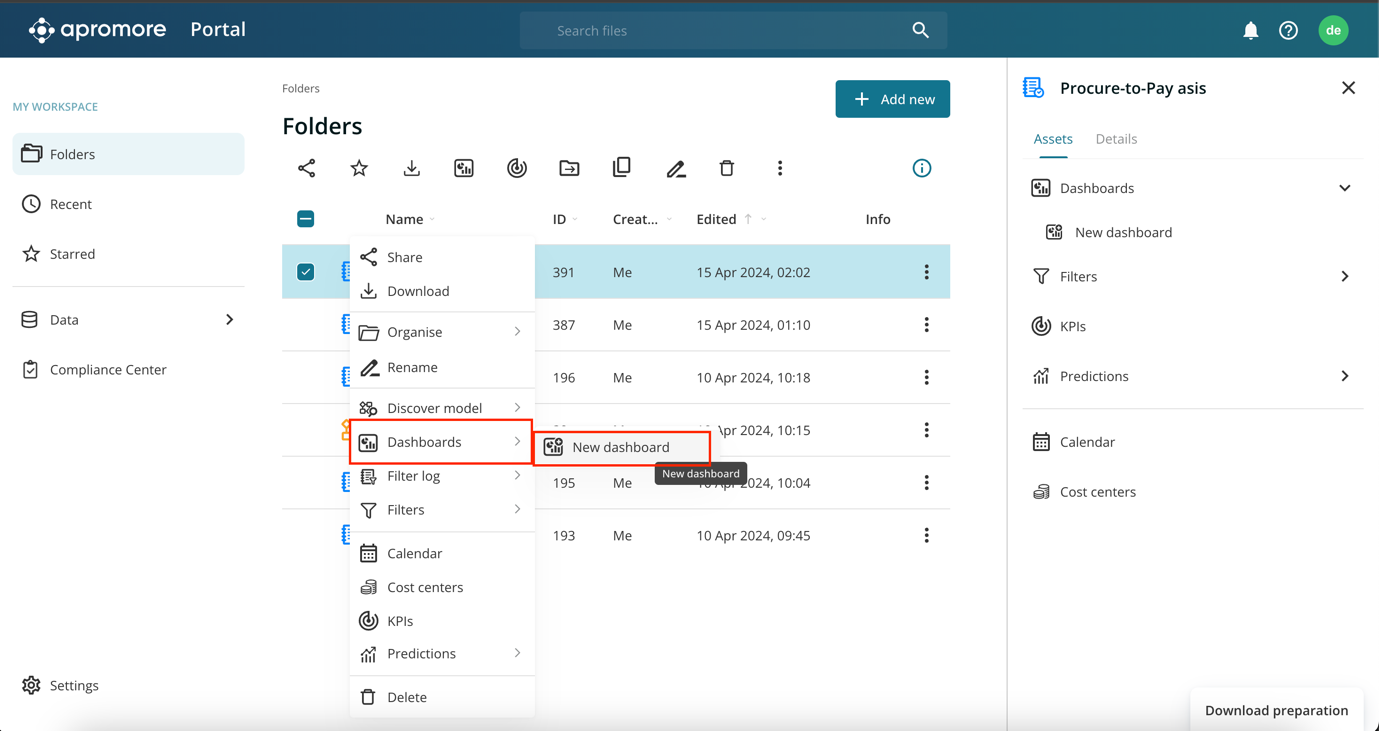
To open the dashboard plugin, select at least one event log, right-click, and select Dashboards> New dashboard to create a new dashboard.
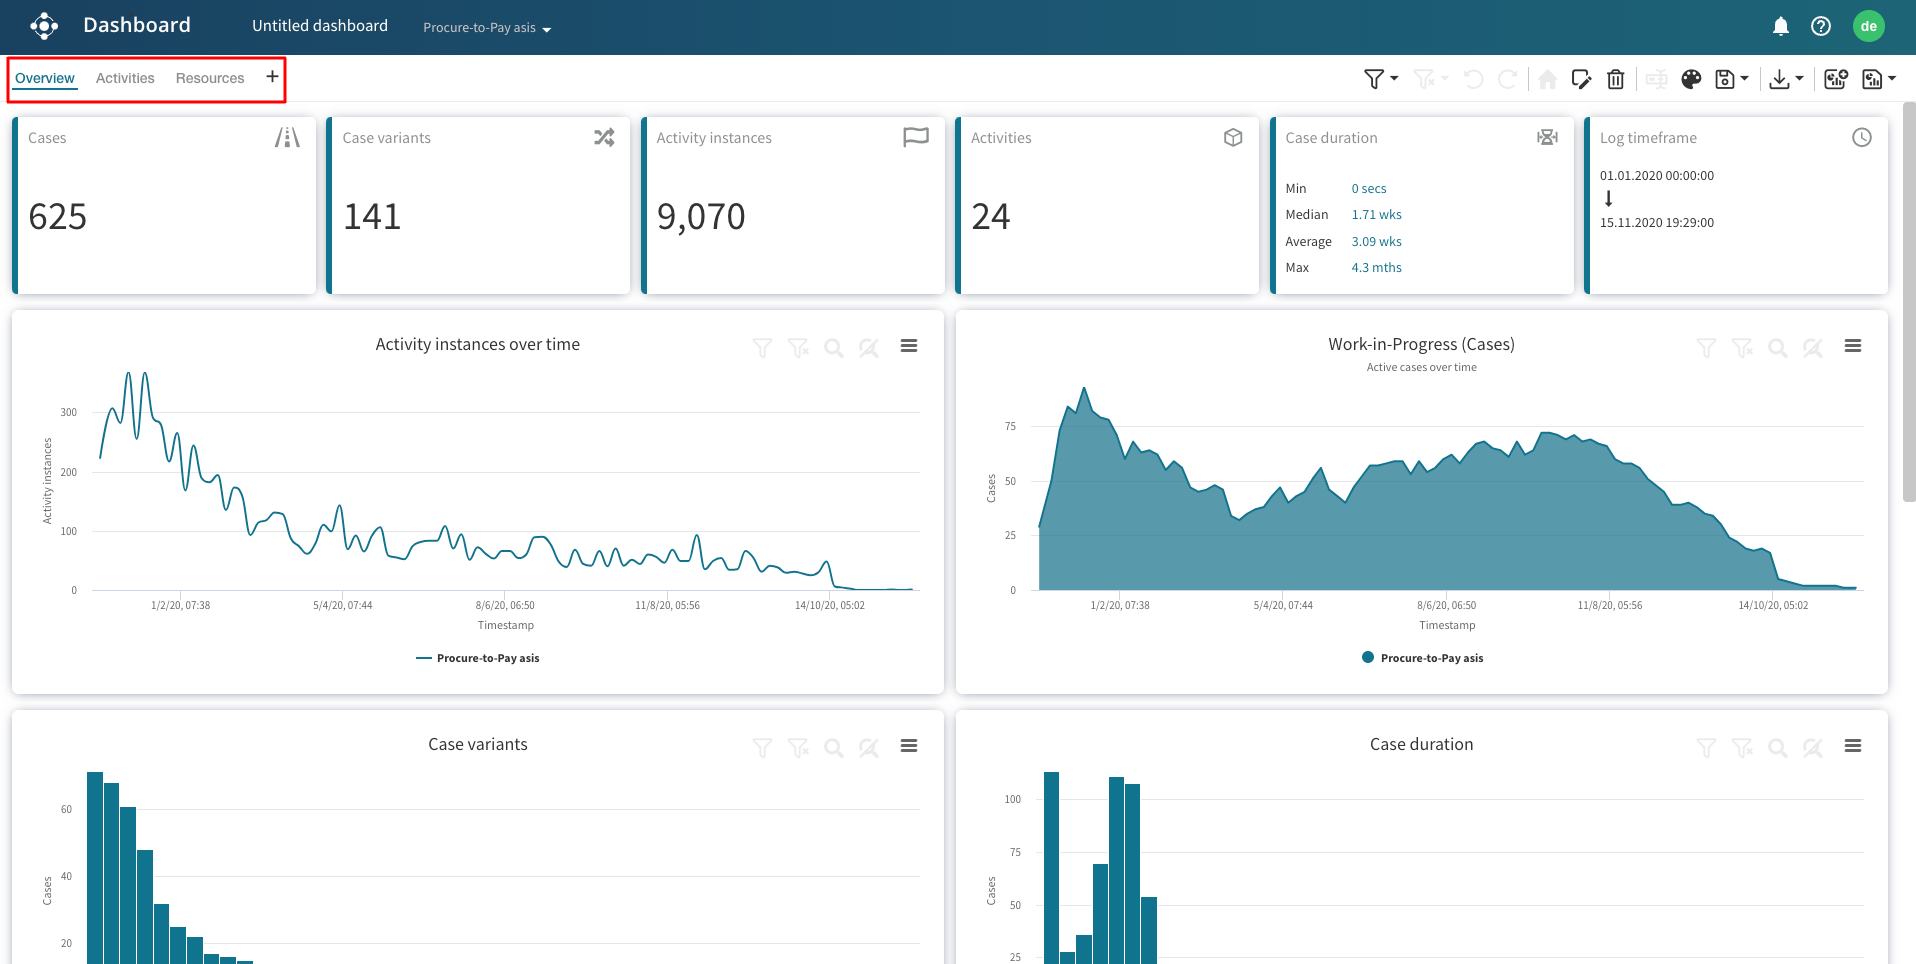
The customizable dashboard consists of three default views: Overview, Activities, and Resources. All the dashboards include statistic tiles, charts, and tables.
We can also compare multiple process variants in the dashboard. To do this, select at least two event logs, right-click, and select Dashboards> New dashboard.
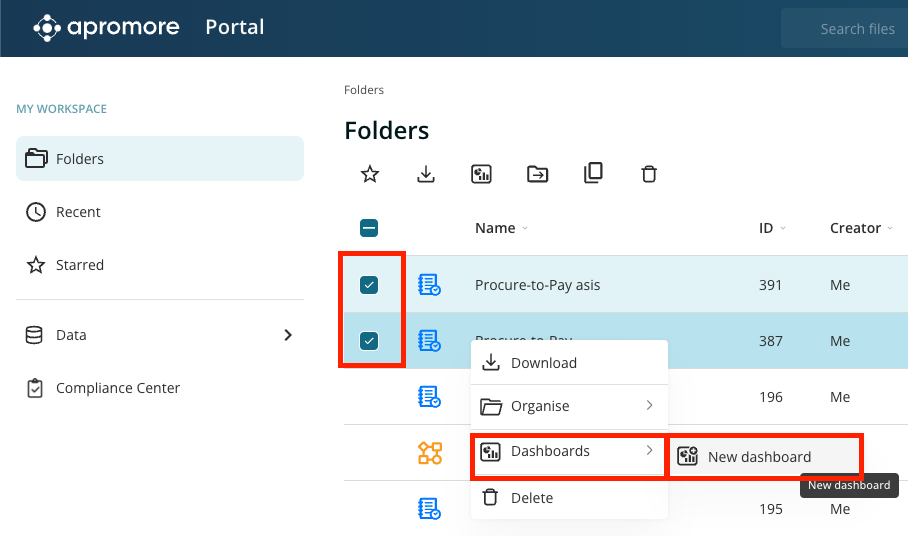
The dashboard is opened, showing the statistics of the multiple event logs.
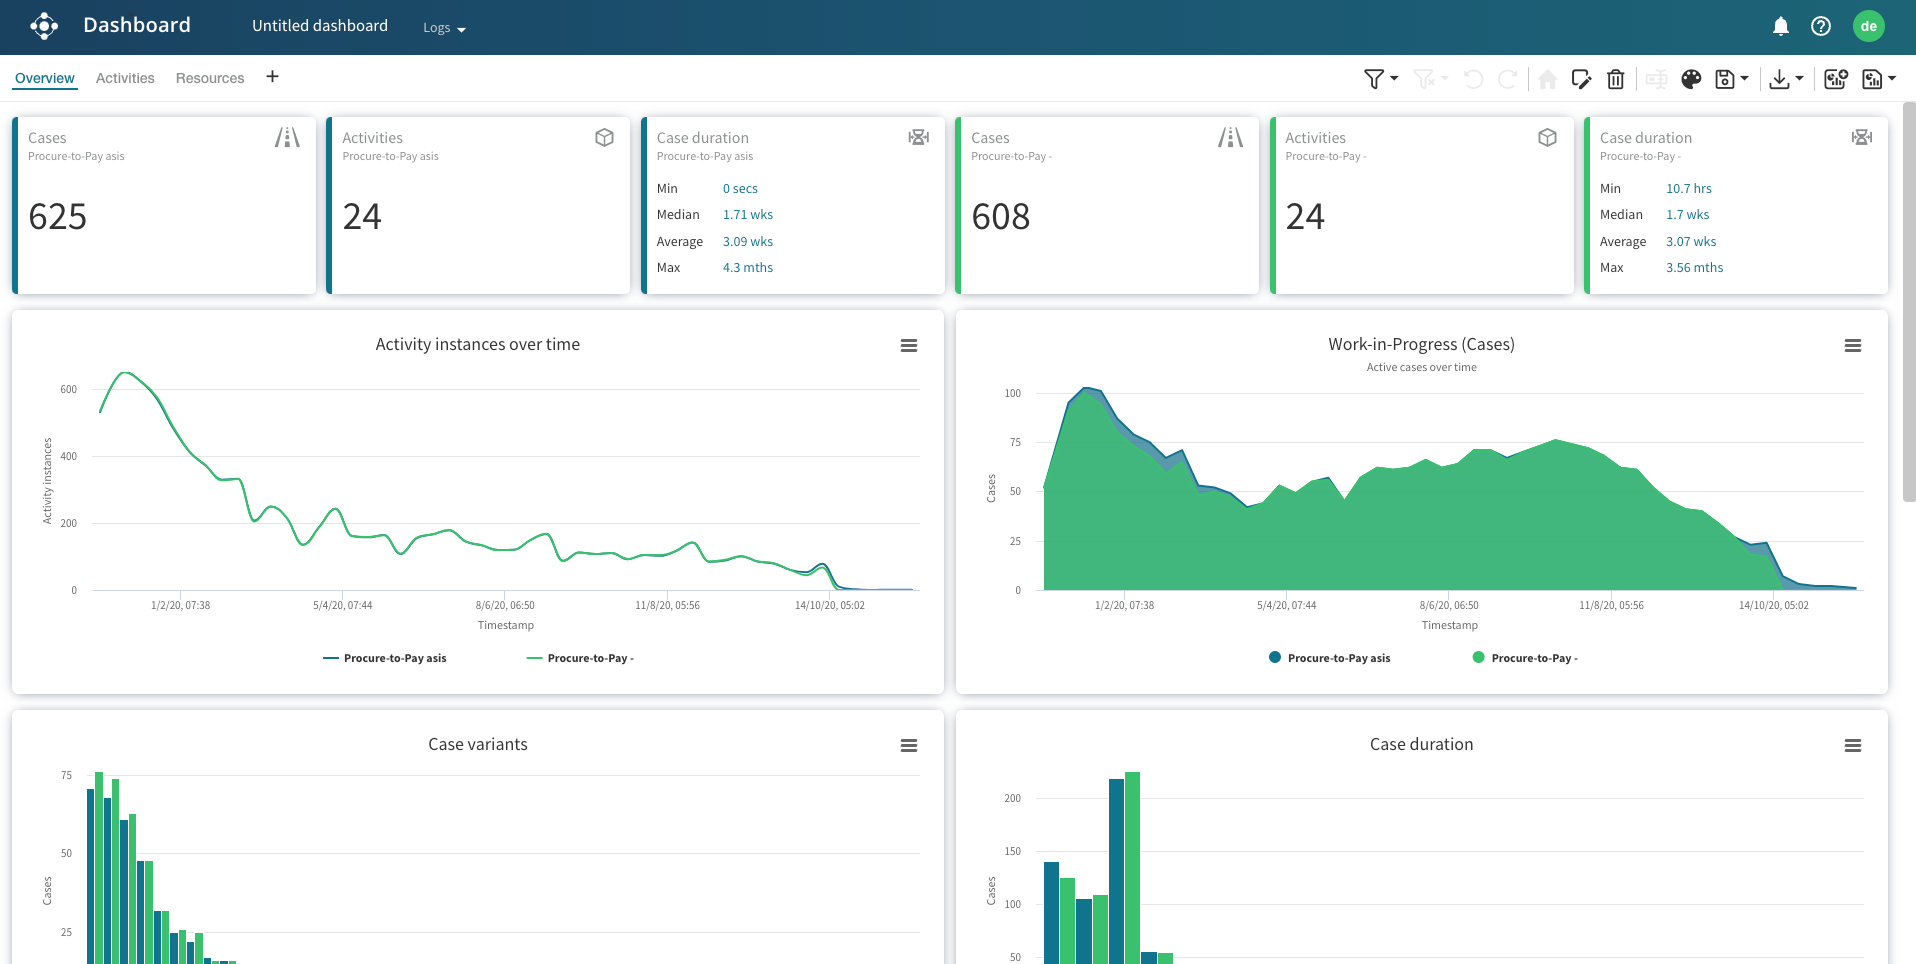
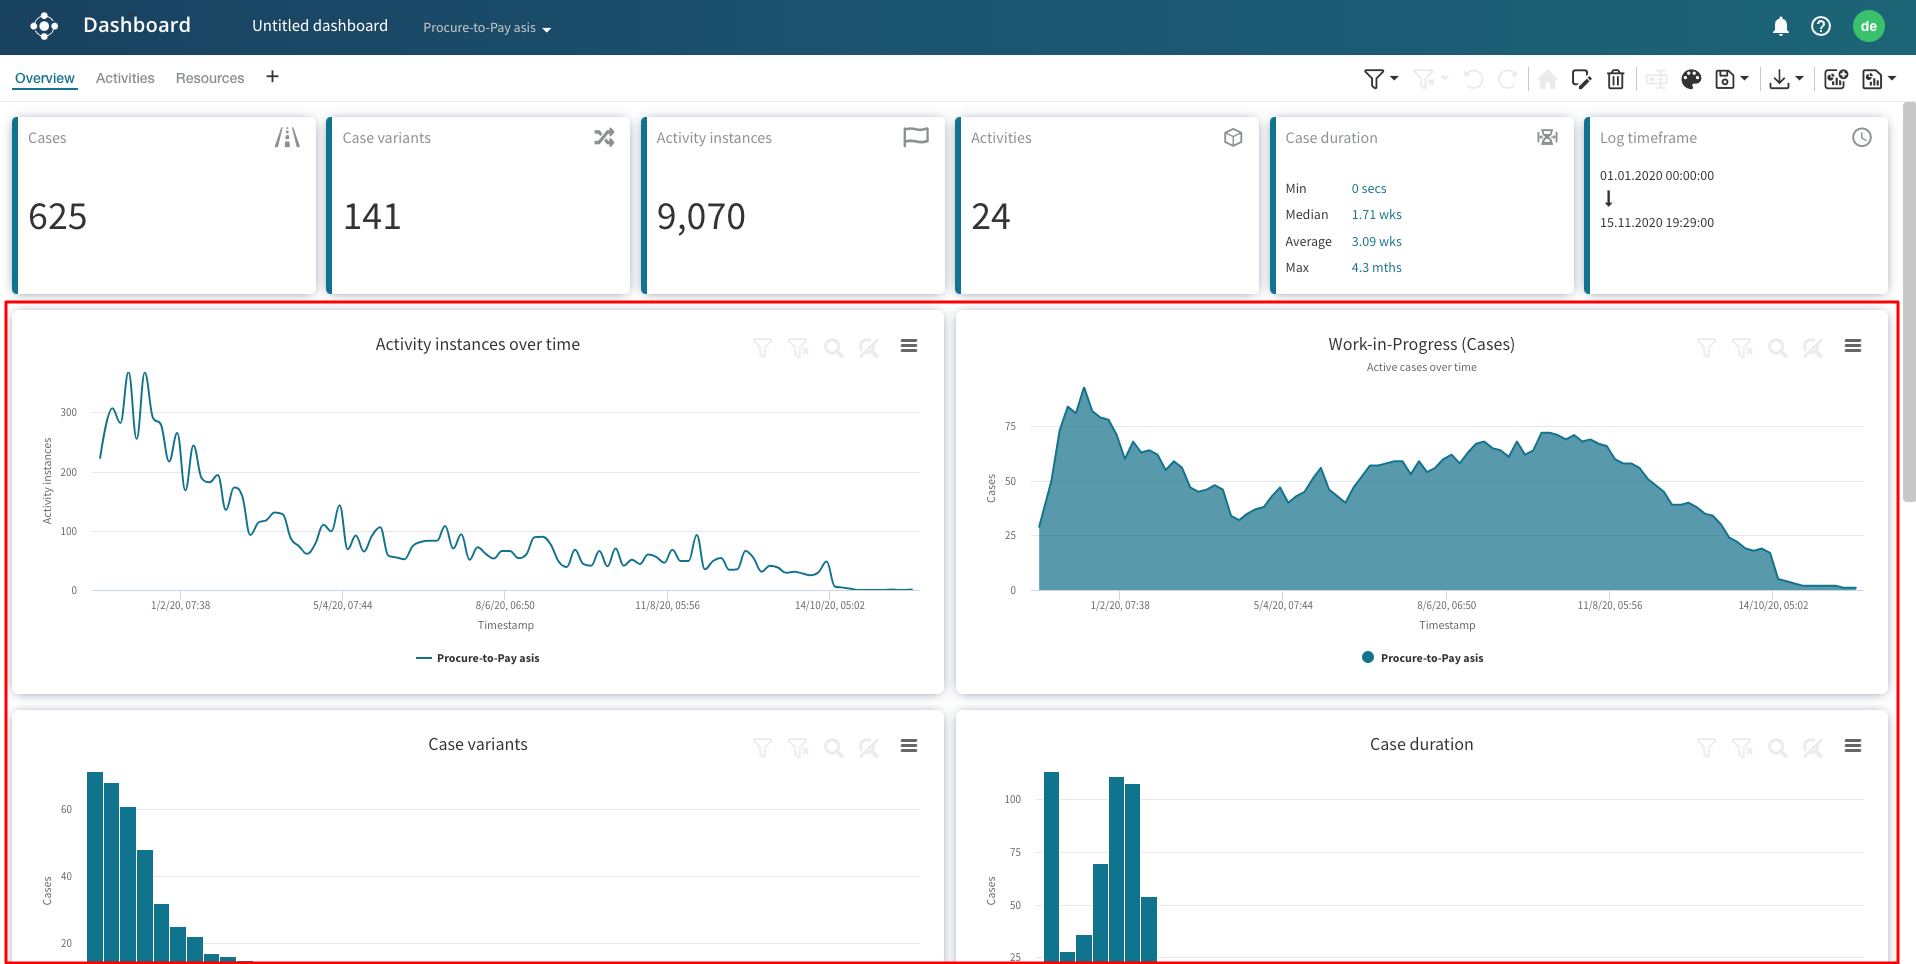
Overview
The overview dashboard consists of the event log’s performance measures, such as the number of activity instances, active cases over time, case variants, case duration, and log timeframe. Four charts are presented in the overview dashboard: Activity instances over time, Work-in-progress (WIP), Case variants, and Case duration.
The overview dashboard also contains the details of cases and case variants for the selected event log, together with their corresponding statistics.
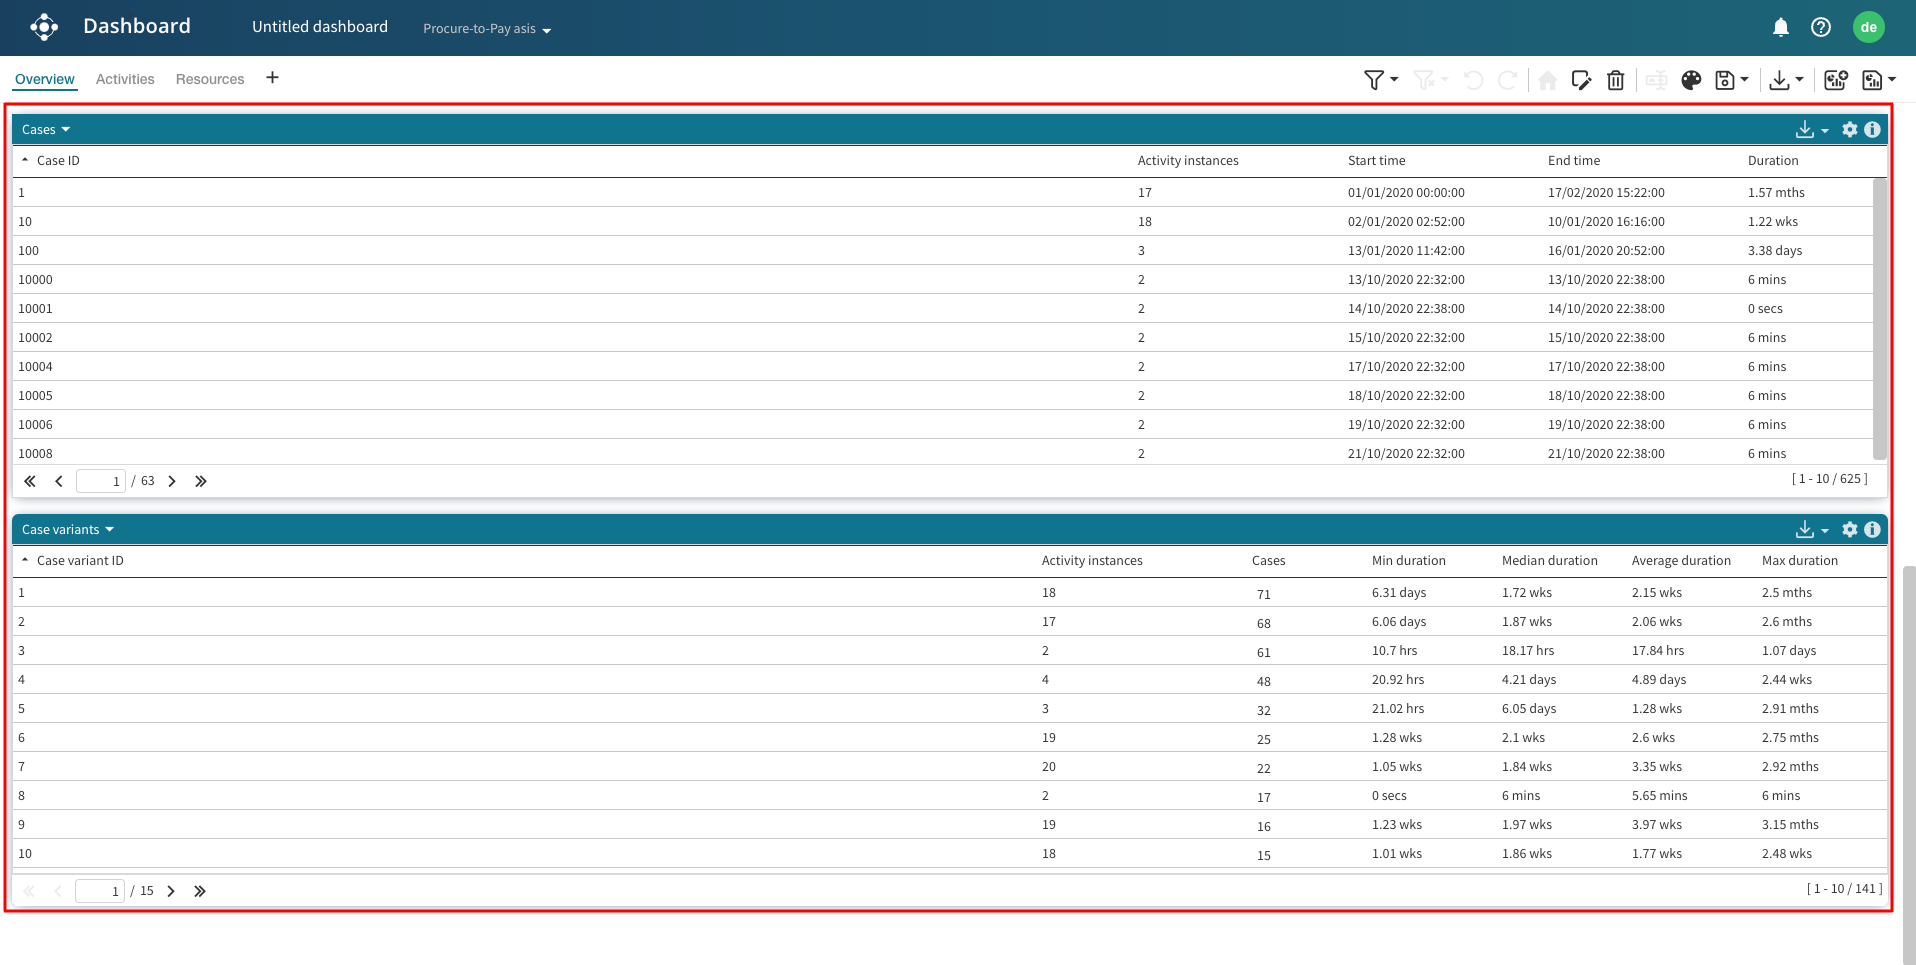
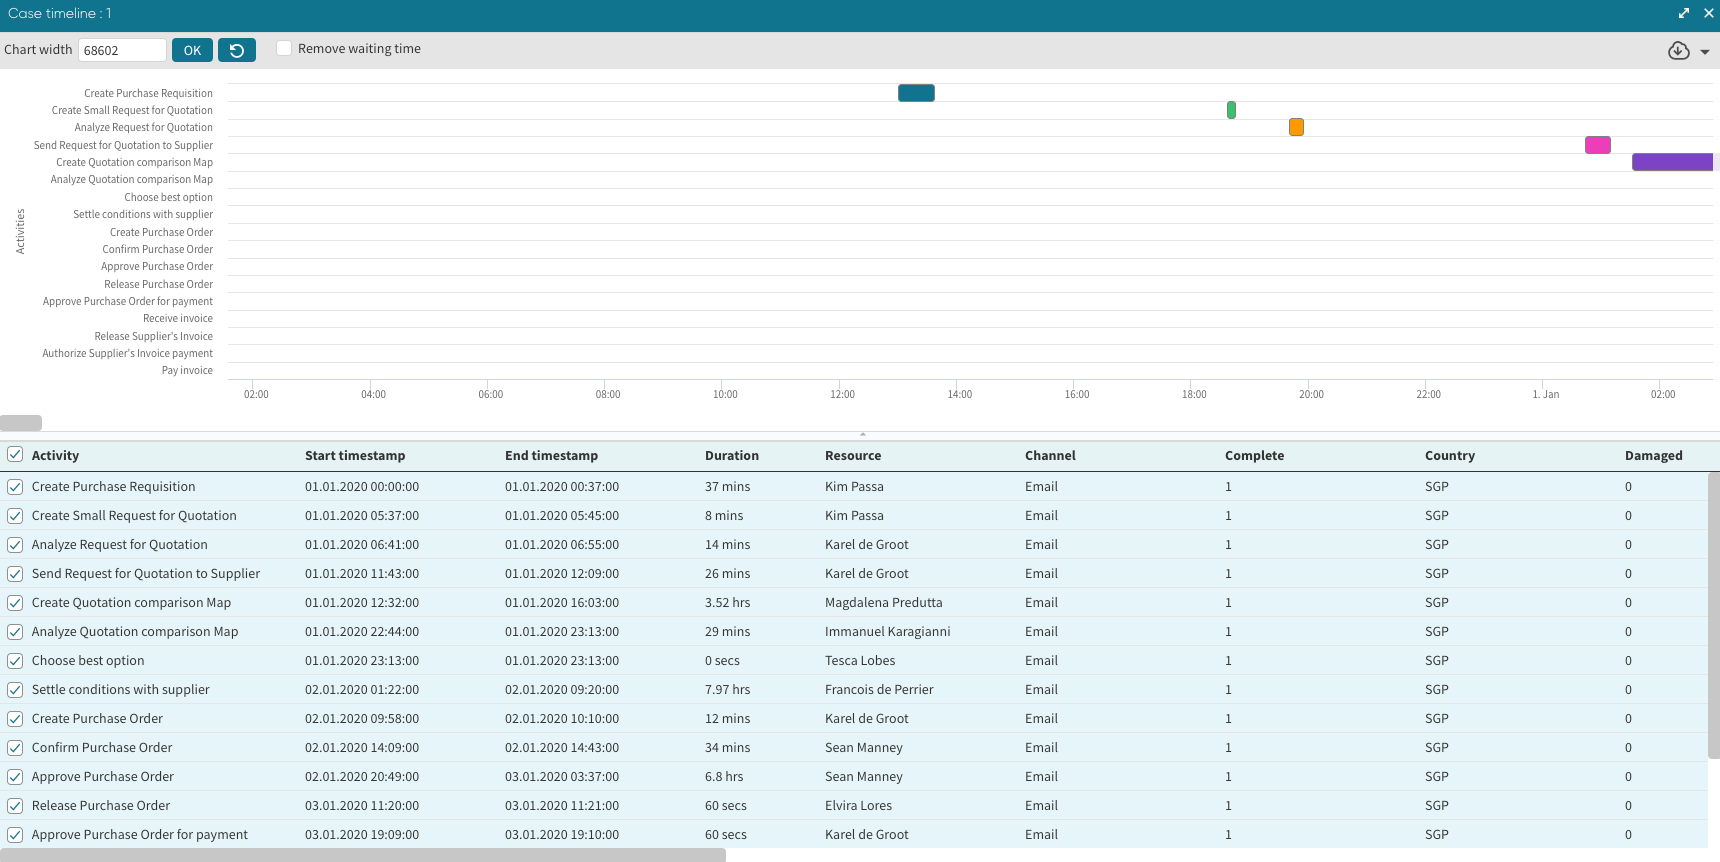
In the Cases table, we can double-click a case to display the Case timeline.
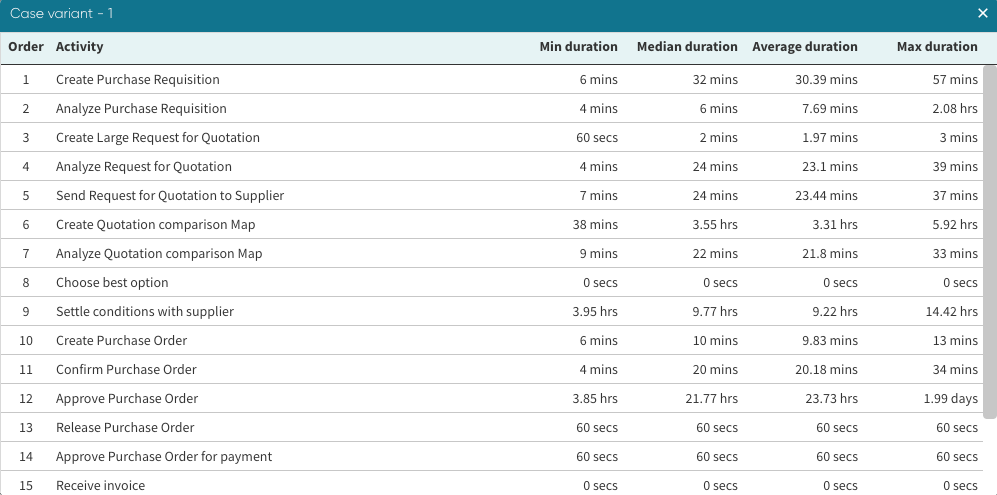
In the Case variants table, we can double-click on a case to get further details about the activities performed in this case variant.
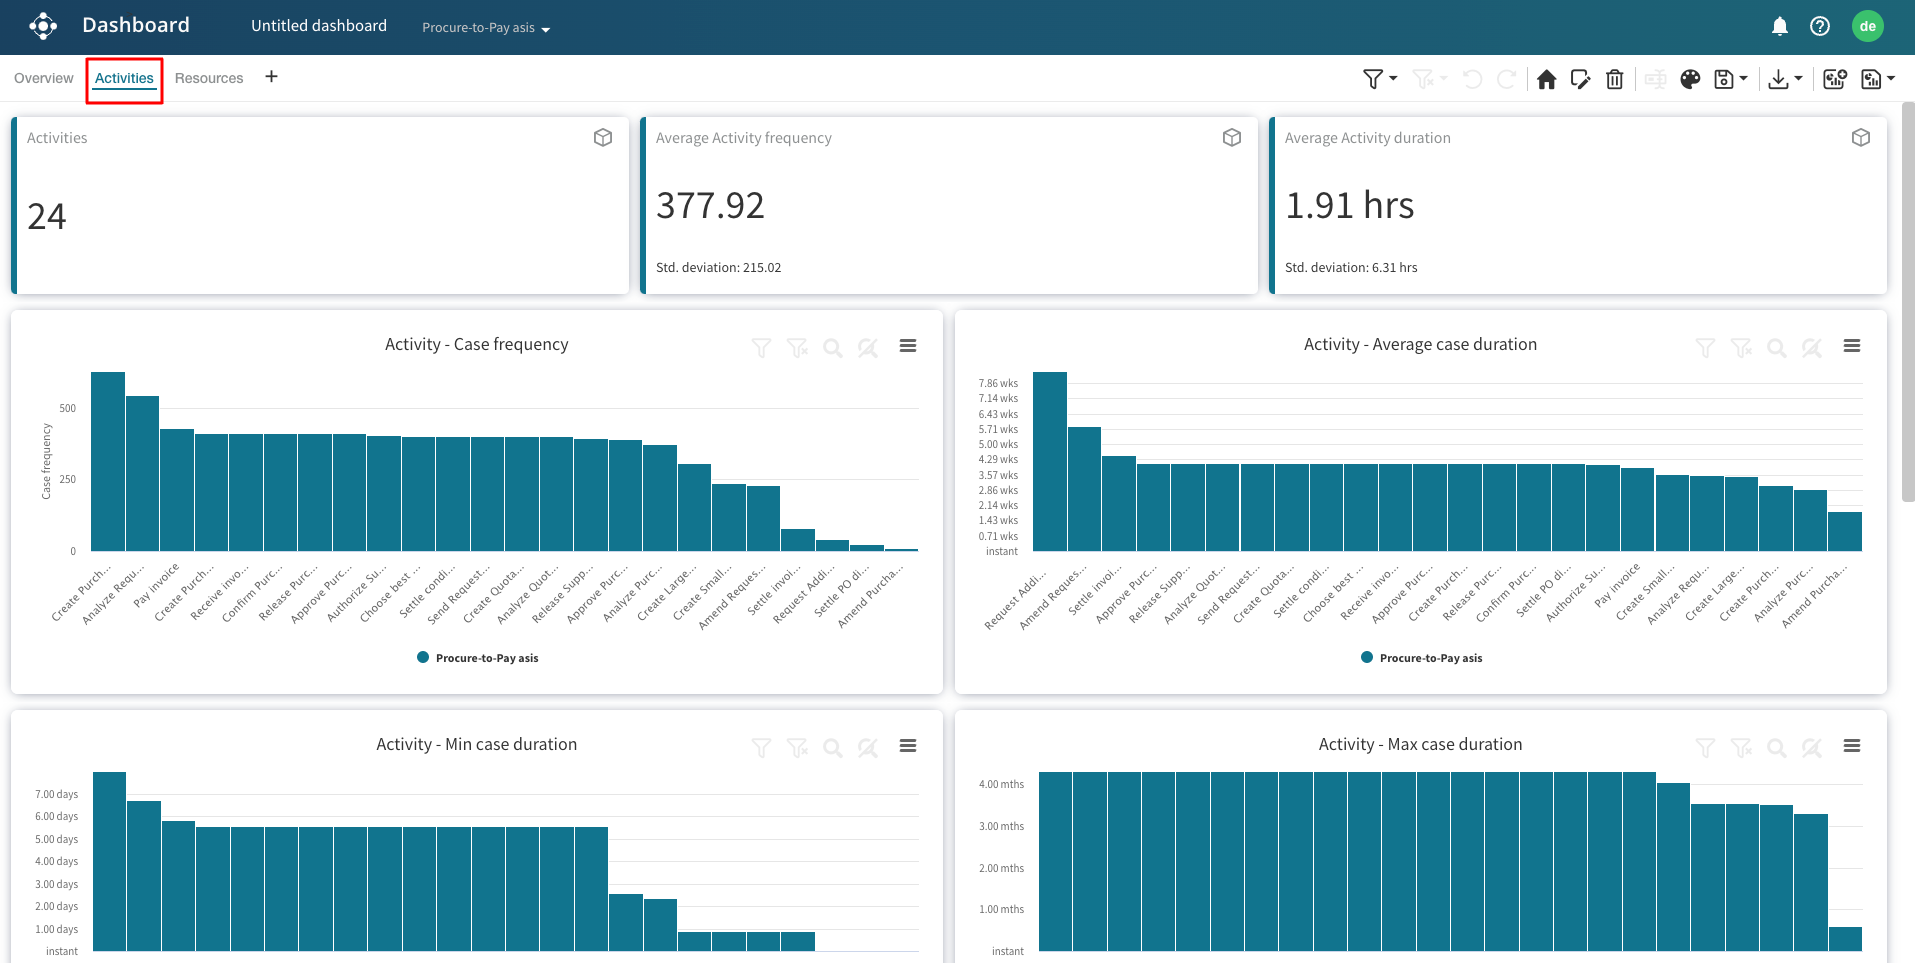
Activities
The activities dashboard includes the activities, average activity frequency, and average activity duration statistic tiles. It also includes different charts of various activity performance metrics such as case frequency, min/max duration, min frequency per case, et cetera.
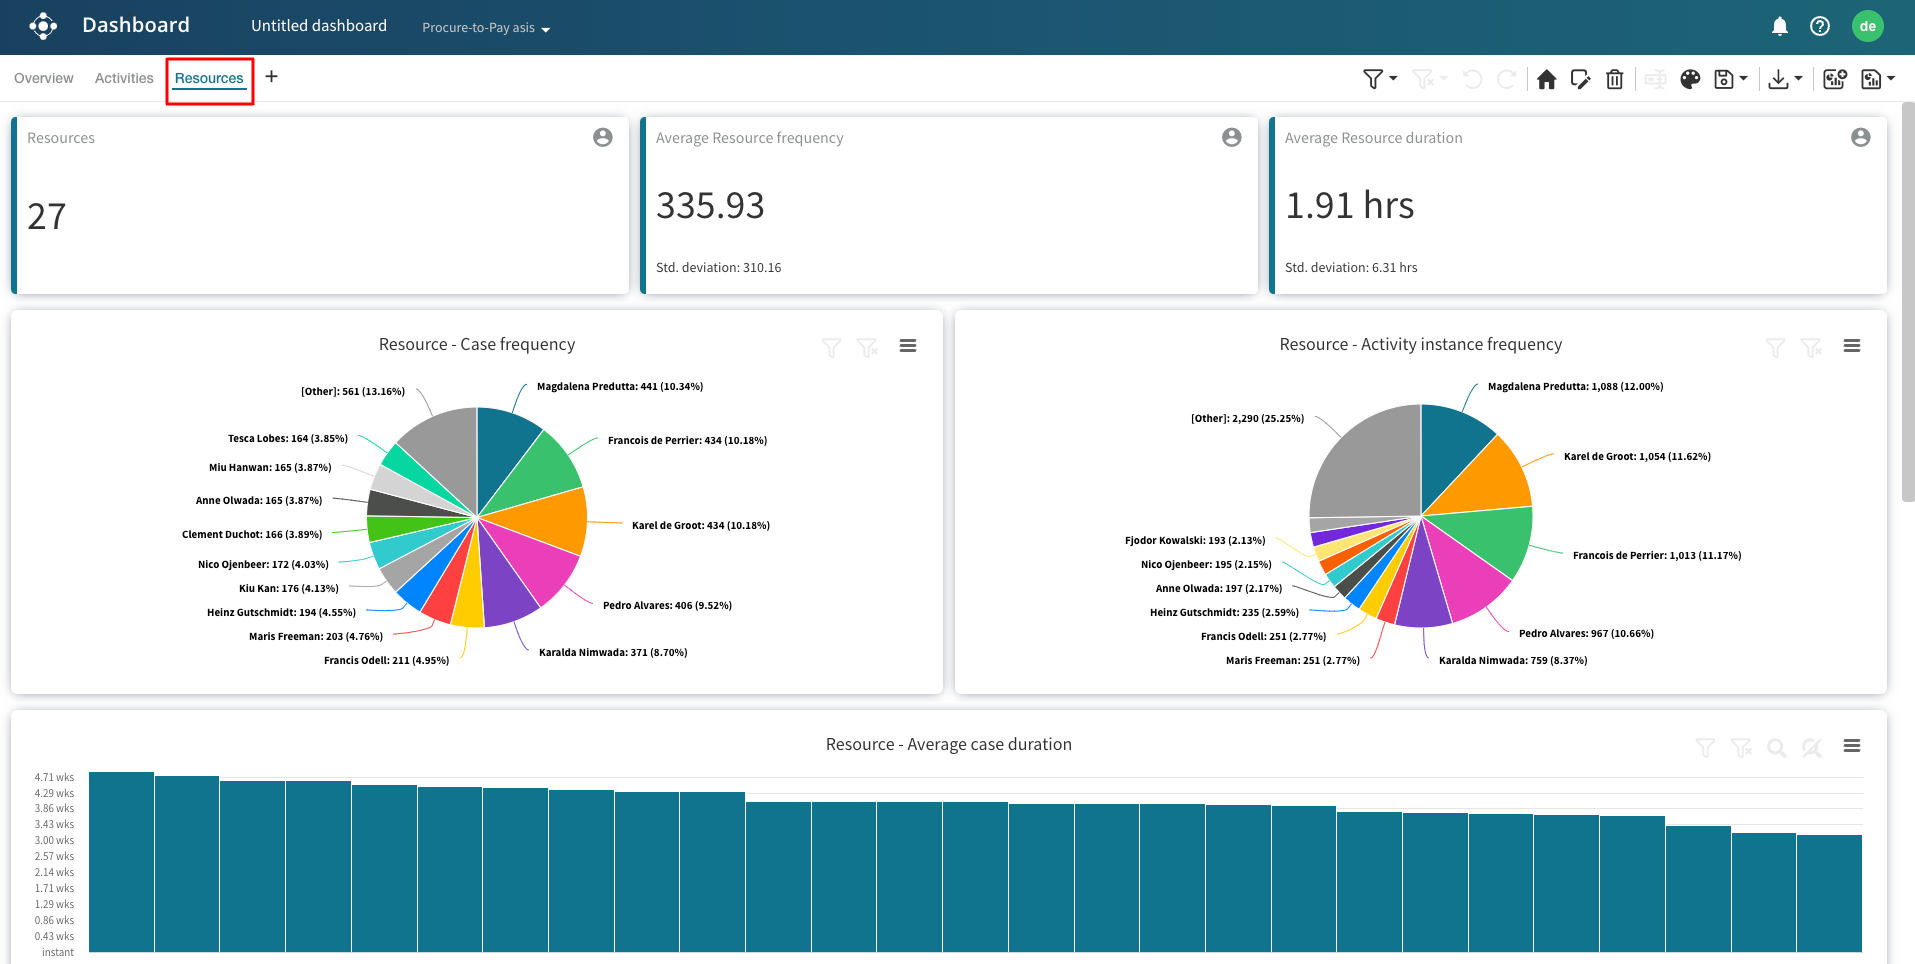
Resources
The resources dashboard includes all the resource performance metrics like case frequency, total frequency, average duration, min duration, and max duration.
Note
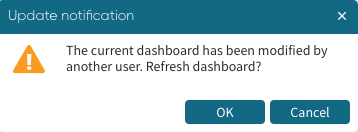
While viewing/editing a shared dashboard, we may receive an update notification stating that the dashboard is modified. This implies that the other user has saved a new version of the dashboard. We can click OK to refresh the dashboard to the latest or Cancel to not refresh.