Generate PAAR Draft
To assist users in assessing automation opportunities, Apromore provides the capability to generate a Process Automation Assessment Report (PAAR). A PAAR provides a summary of the benefits of automating one or more activities in a process. In other words, we can determine the effect of replacing a human resource or a group of resources with a bot.
To generate a PAAR, we should first:
Simulate an as-is model. This model contains the current process where one or more activities are done manually.
Simulate a what-if scenario where one or more activities are automated. The automation of an activity involves two things. First, the activity is assigned to a bot instead of human resources, and second, the duration of the activity is reduced. Thus, we’d need to create a new ‘bot’ resource and assign it to the task(s) we wish to automate.
As a result, we will have the following four files in our Apromore Workspace:
An “as-is” simulation model (before the automation, i.e., with human resources).
An “as-is” simulated log.
A “what-if” simulation model (with an assigned “bot” resource).
A “what-if” simulated log.
Once we have these four items, we can generate the PAAR.
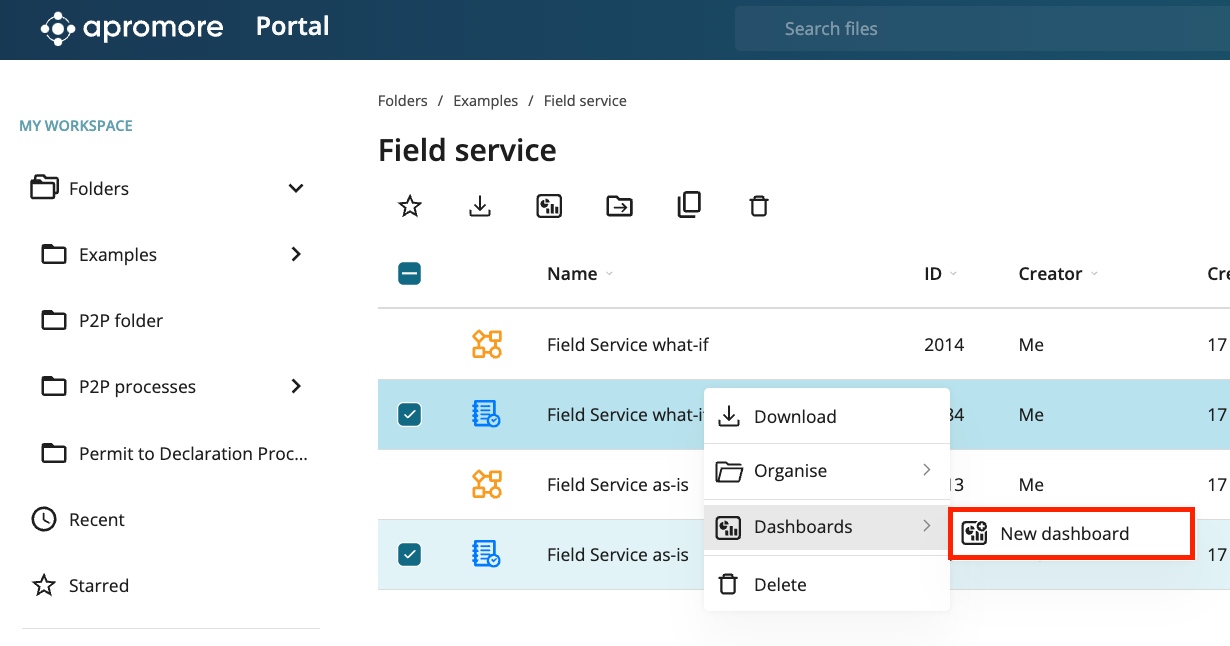
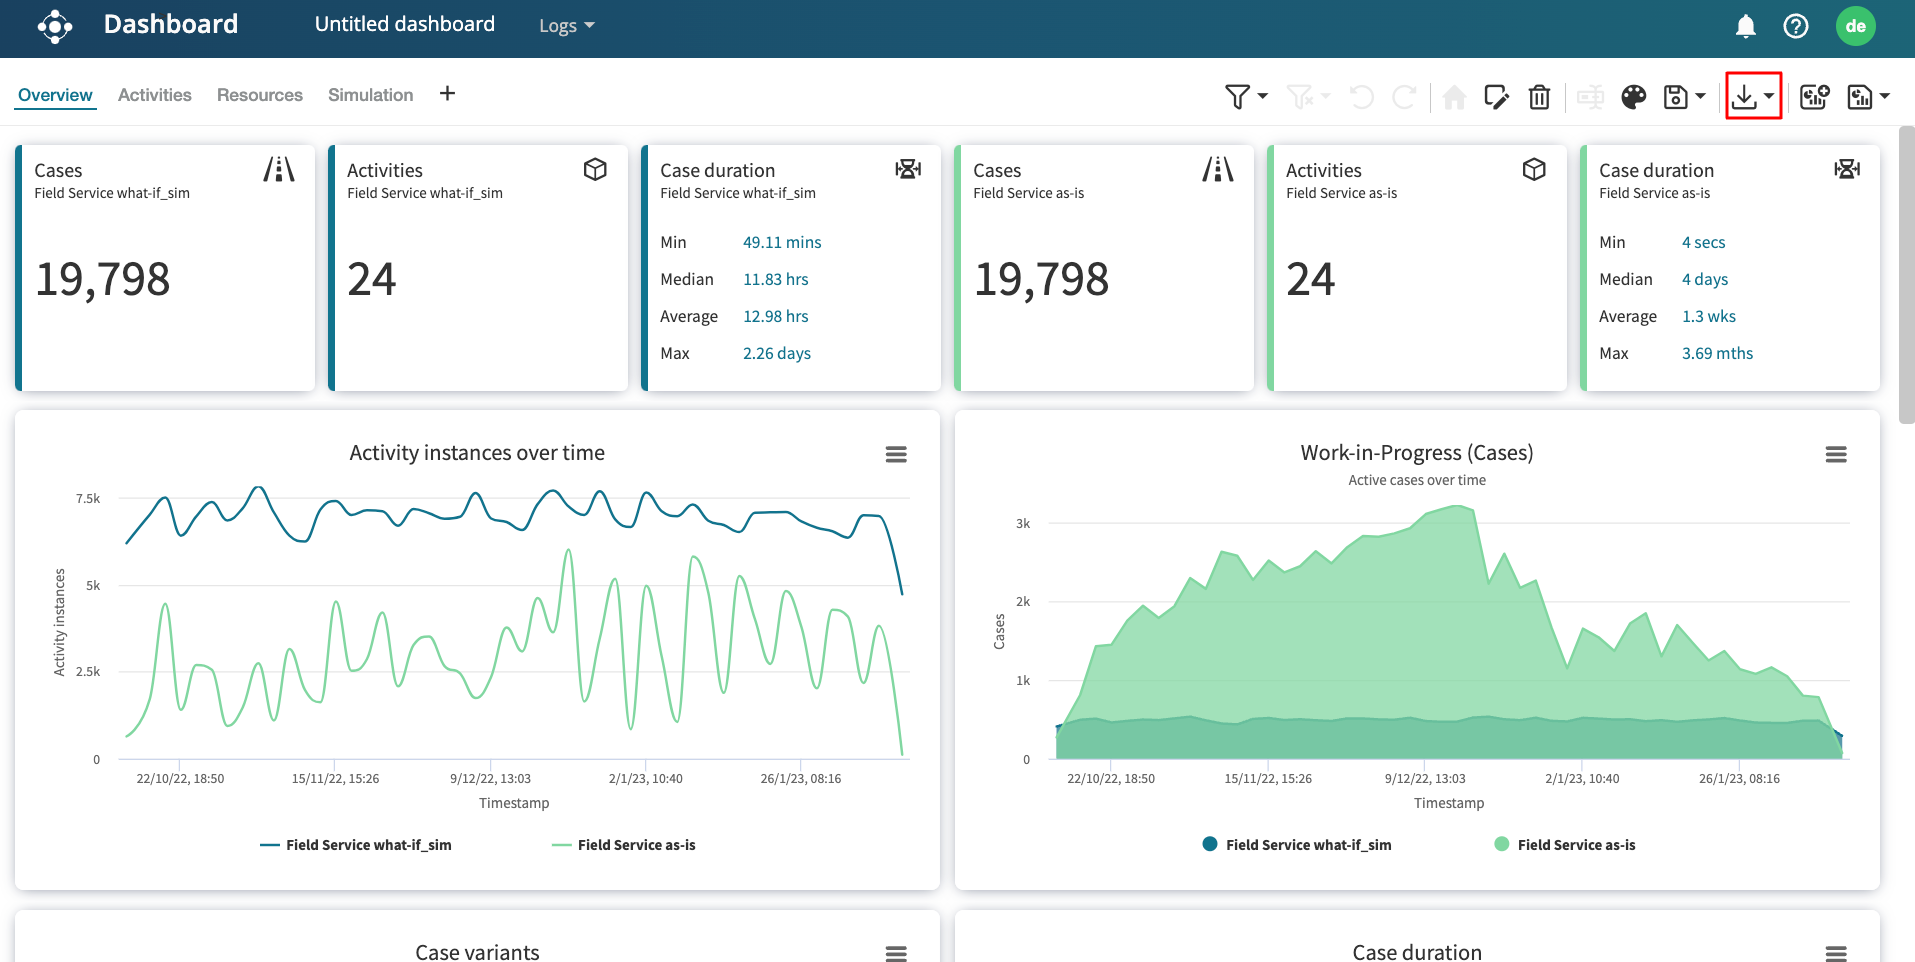
To generate the PAAR, select the two simulated logs (as-is and what-if) and launch them in the Dashboard.
Go to the Overview tab and click the Download icon.
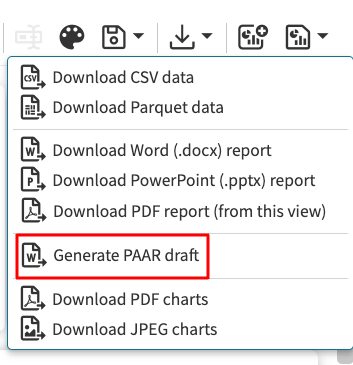
In the dropdown, select Generate PAAR draft.
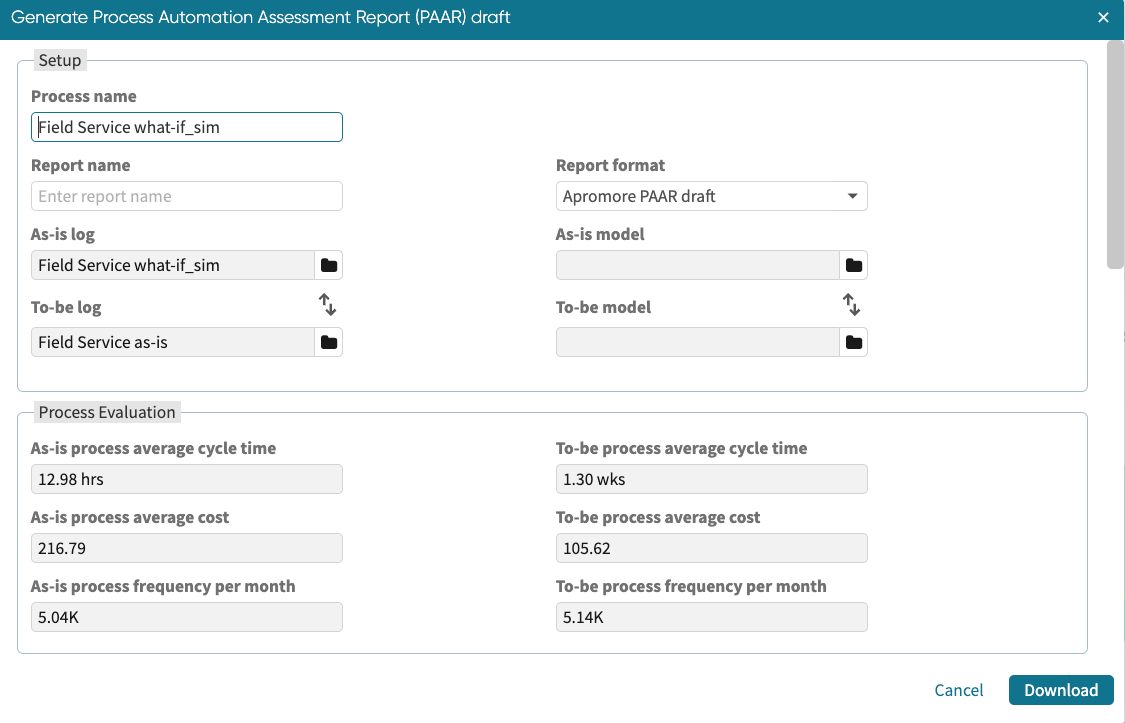
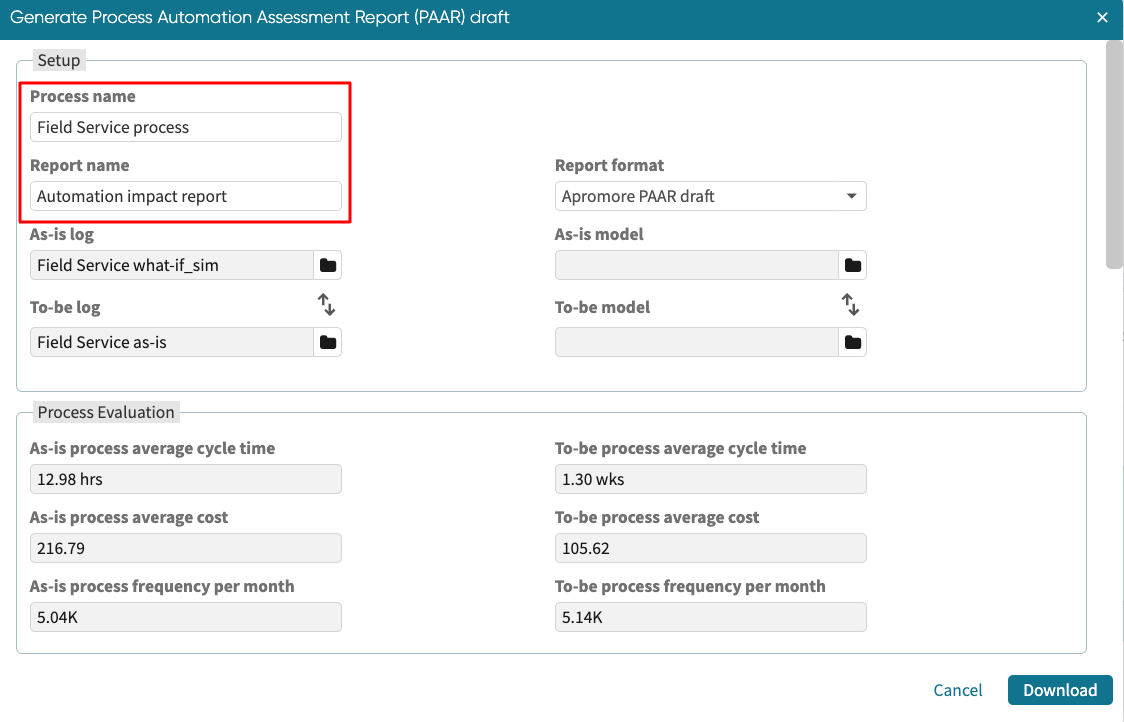
The Generate PAAR report window is displayed.
Enter the Process name and the Report name.
Select Apromore PAAR draft as the Report format.
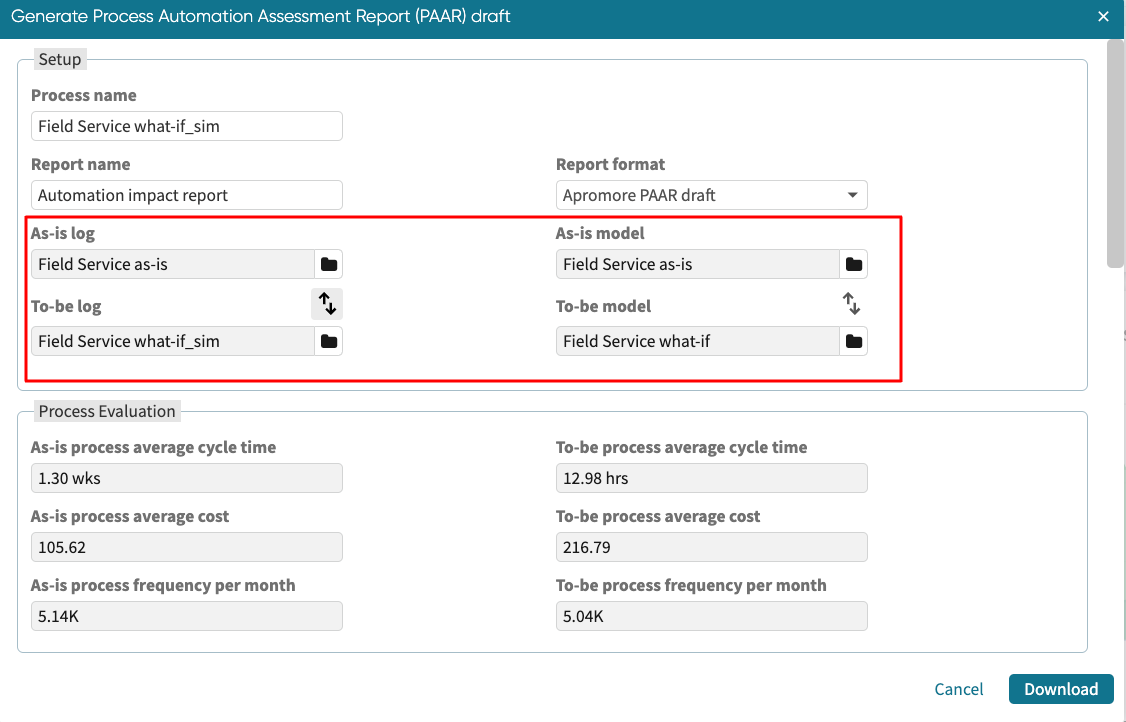
Select the As-is log, To-be log, As-is model, and To-be model.
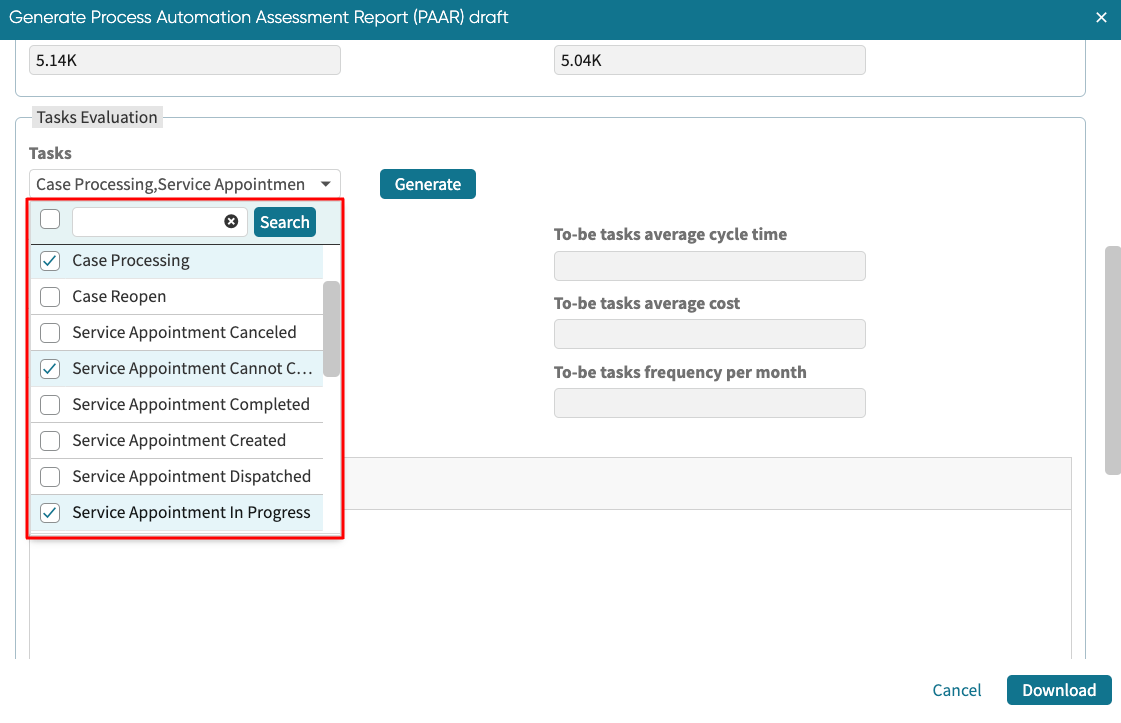
In the Tasks dropdown, select the tasks that were automated. These tasks were assigned to the ‘bot’ resource in the what-if model.
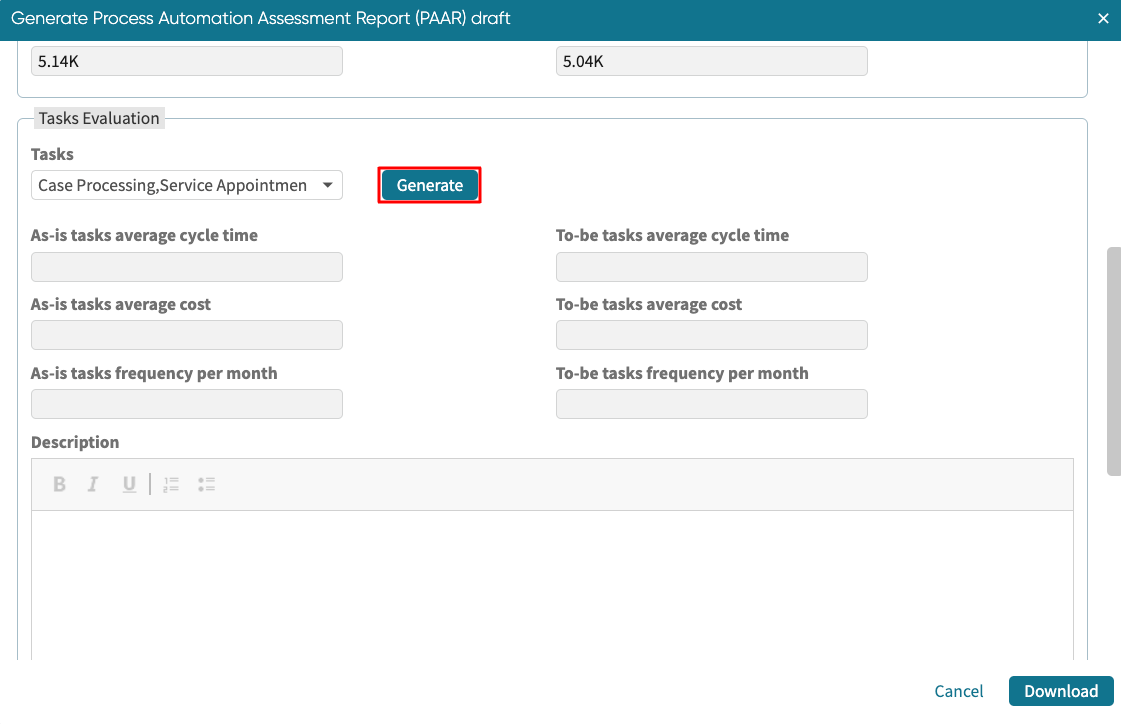
Apromore automatically populates the average duration and average cost for both the as-is and to-be models. These figures are immutable. Scroll down and click Generate.
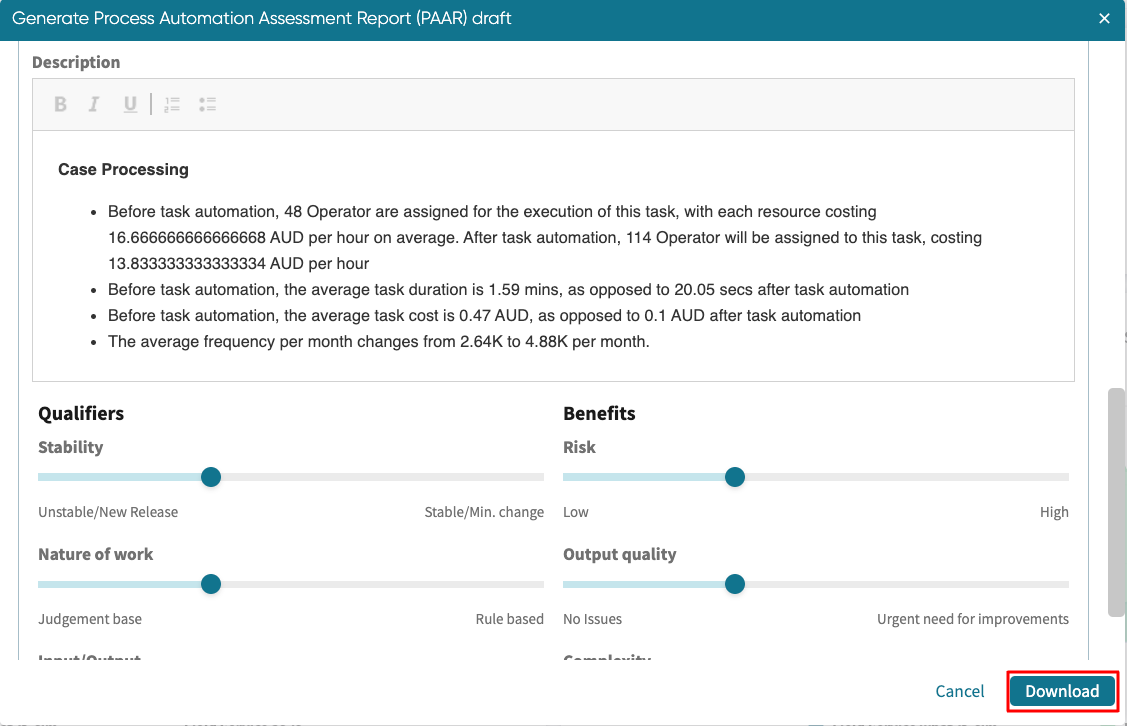
Apromore generates a summary of the benefits of the “what-if” automation scenario in the Description box. The PAAR also includes the following details for each of the selected tasks.
Changes to the resource cost.
Changes to the average task duration.
Changes to the average task cost.
Changes to the average frequency per month.
We can download the report in MS Word. Scroll to the bottom and click Download.
