Create dashboards
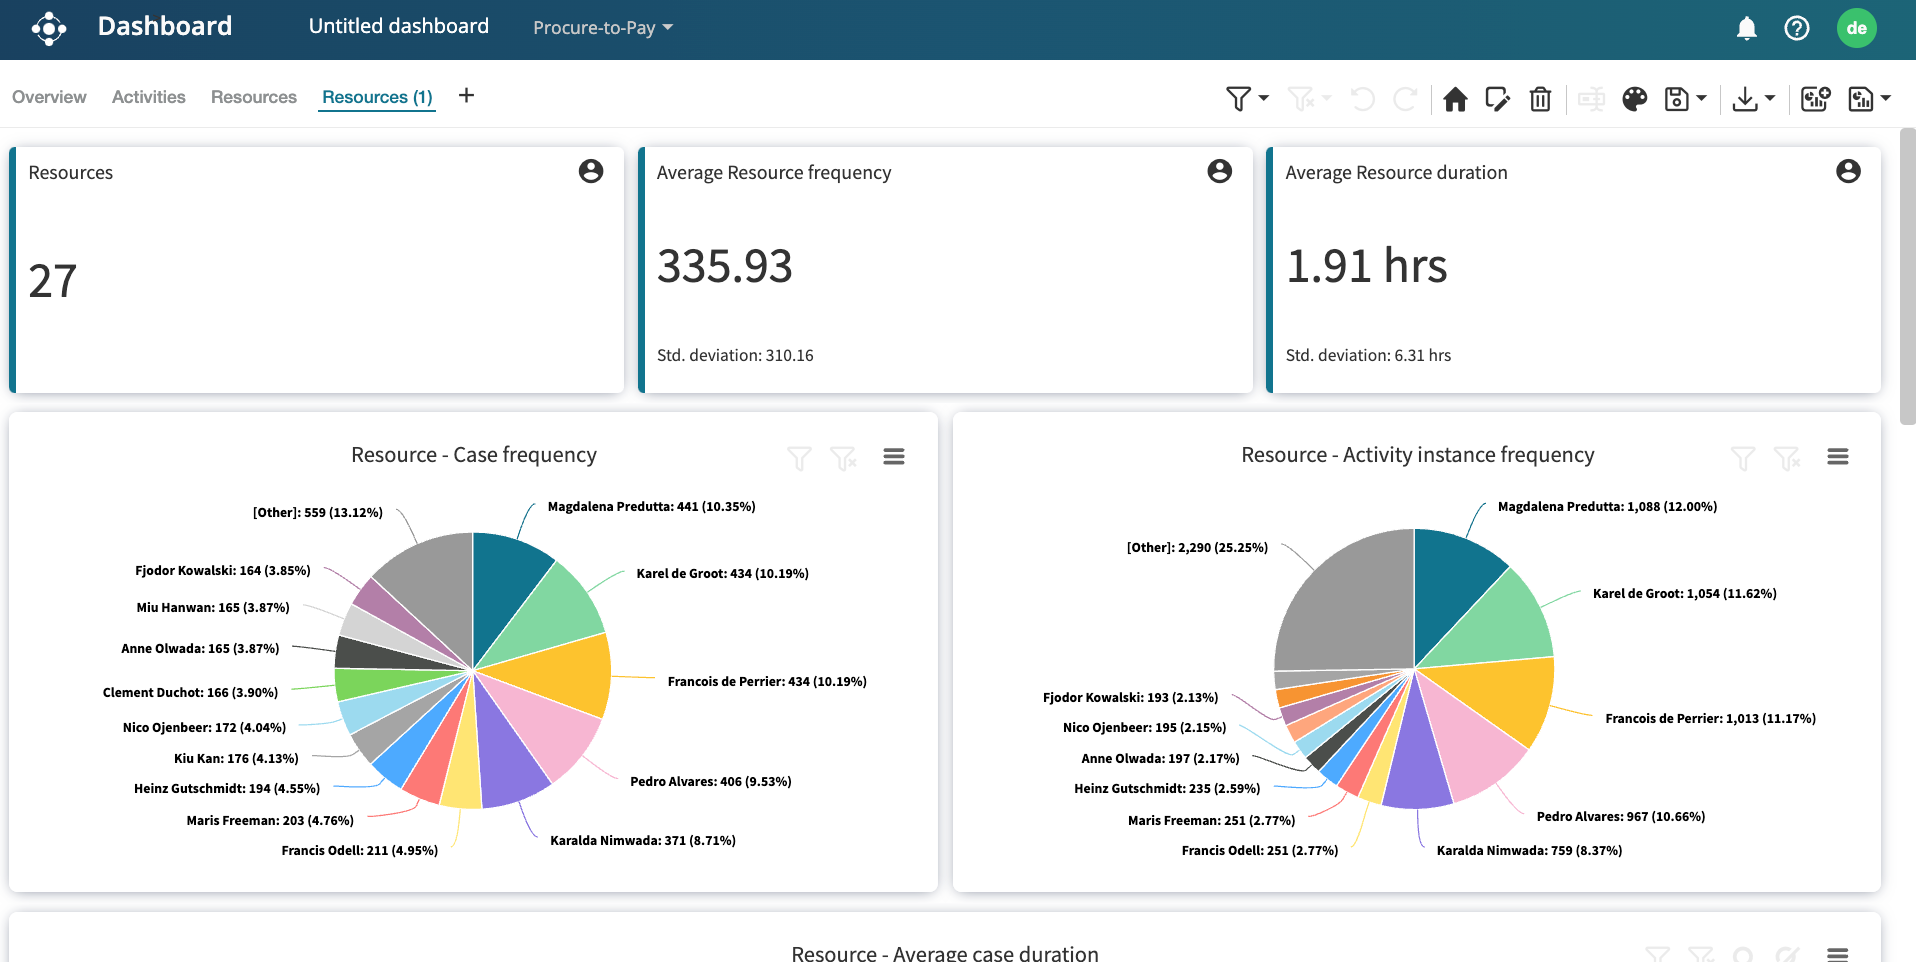
Apromore Performance Dashboard offers a variety of custom visualization options.
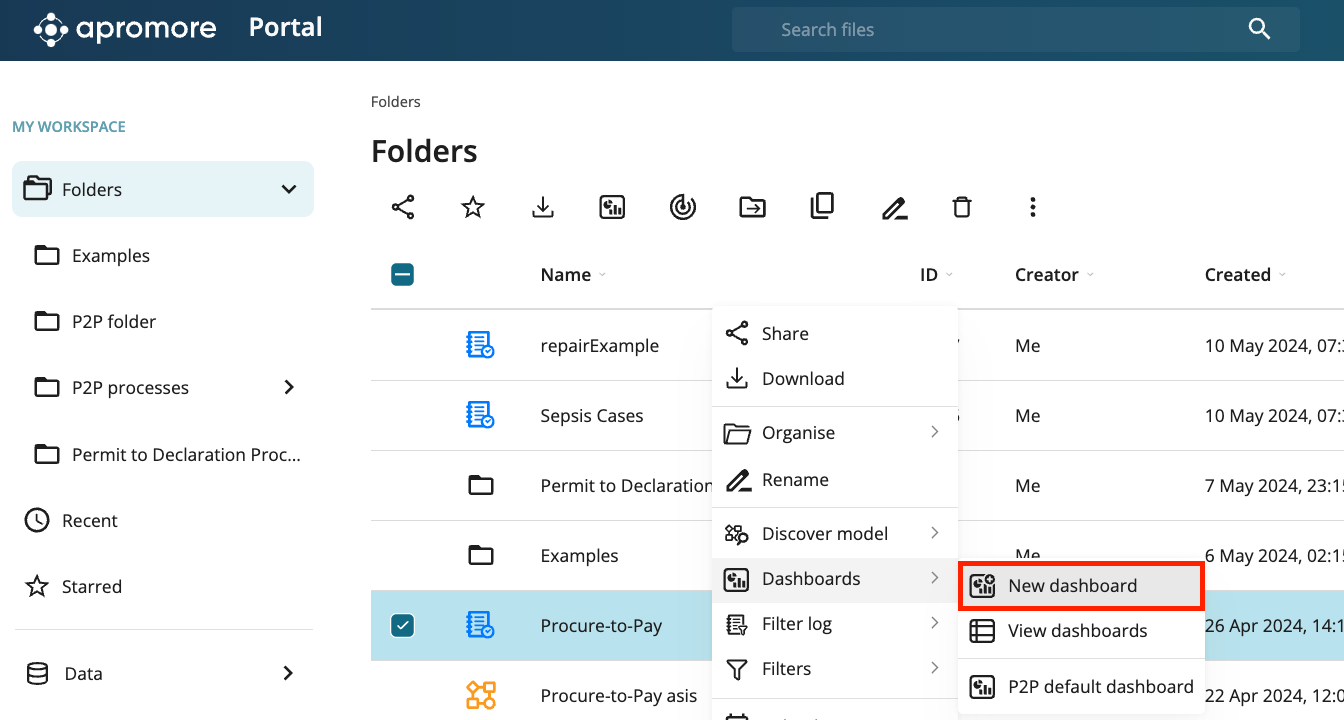
To open the dashboard, select at least one event log, right-click it, and select Dashboards > New dashboard.
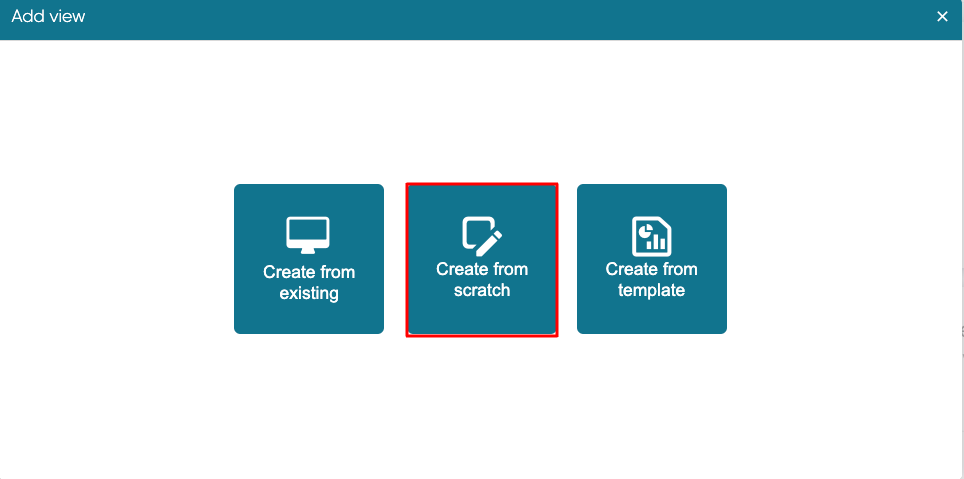
Once the performance dashboard opens up, click on the ‘+’ button to create a dashboard from an existing dashboard or create a dashboard from scratch.
Create from existing views
The main purpose of creating a dashboard from an existing view is to modify an existing view by retaining the existing performance metrics and adding additional performance metrics.
To create a custom dashboard from an existing view, click Create from existing.
We can choose from three different views: Overview, Activities, and Resources.
To create a new dashboard from an existing resources view, click Resources.
A new Resources view is displayed where we can further edit it.
Similarly, we can create a new dashboard from the Overview and Activities view.
Create from scratch
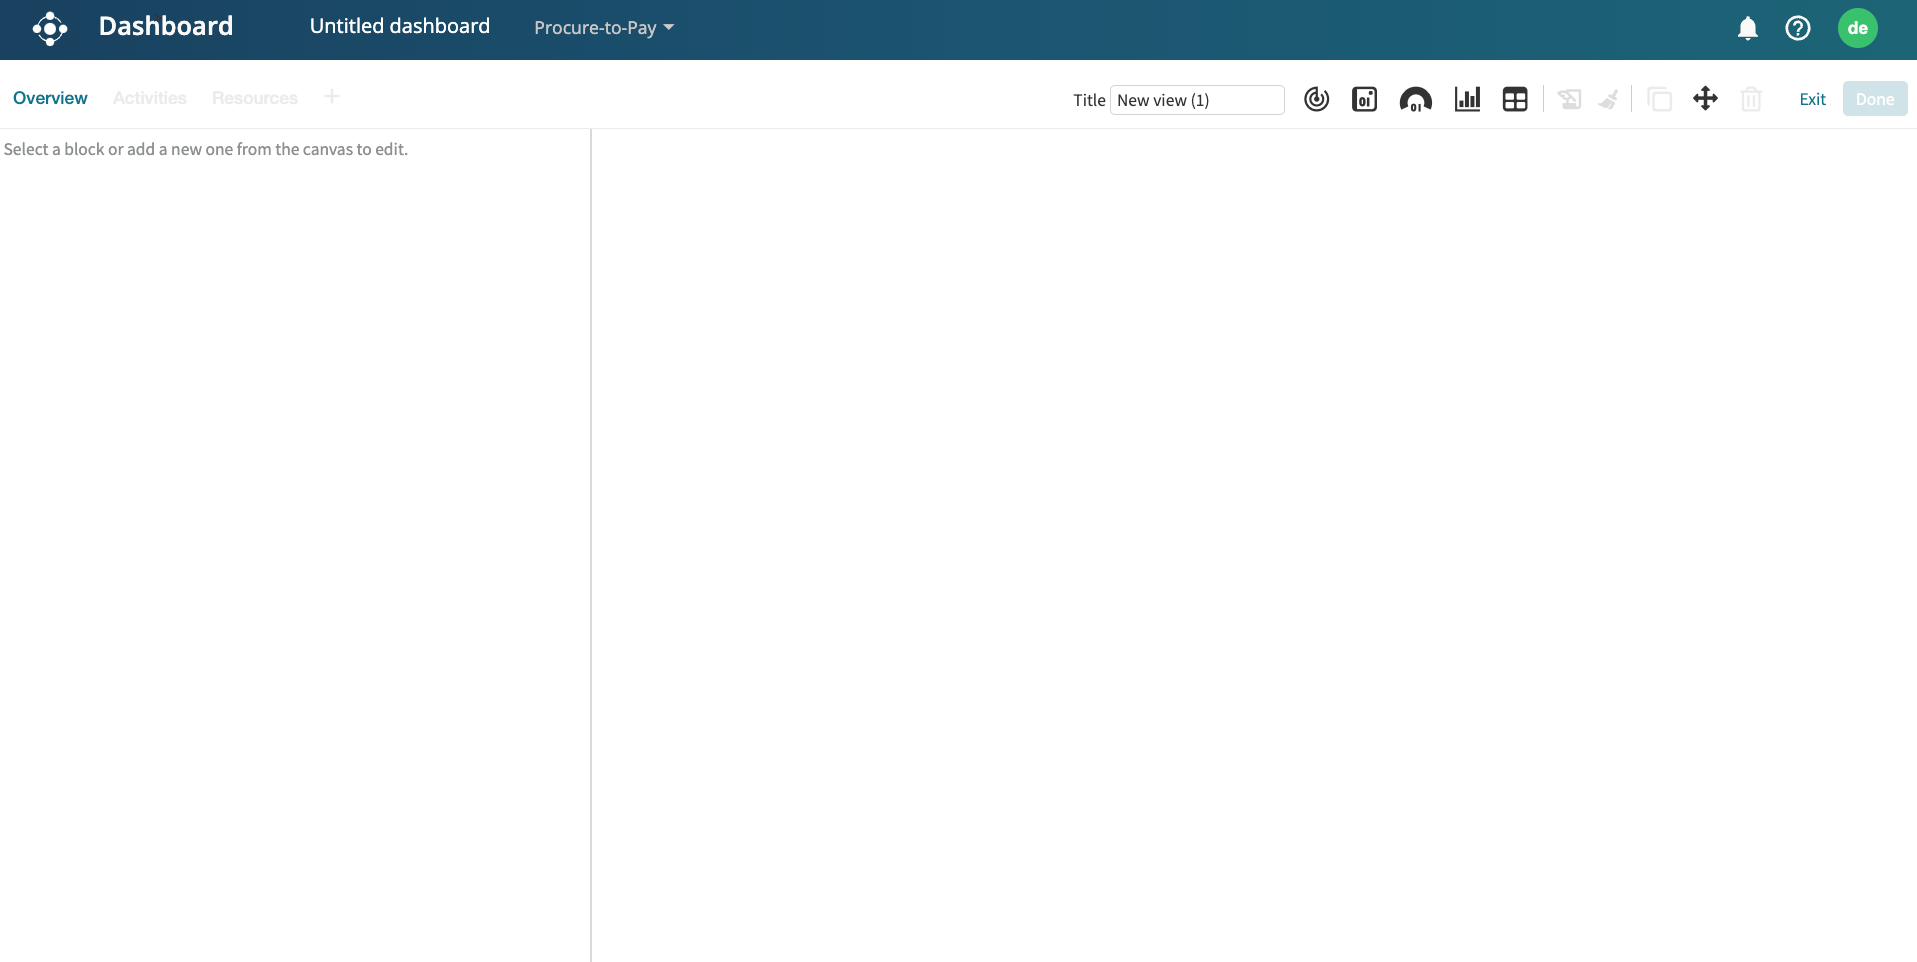
To create a custom dashboard from scratch, click Create from scratch.
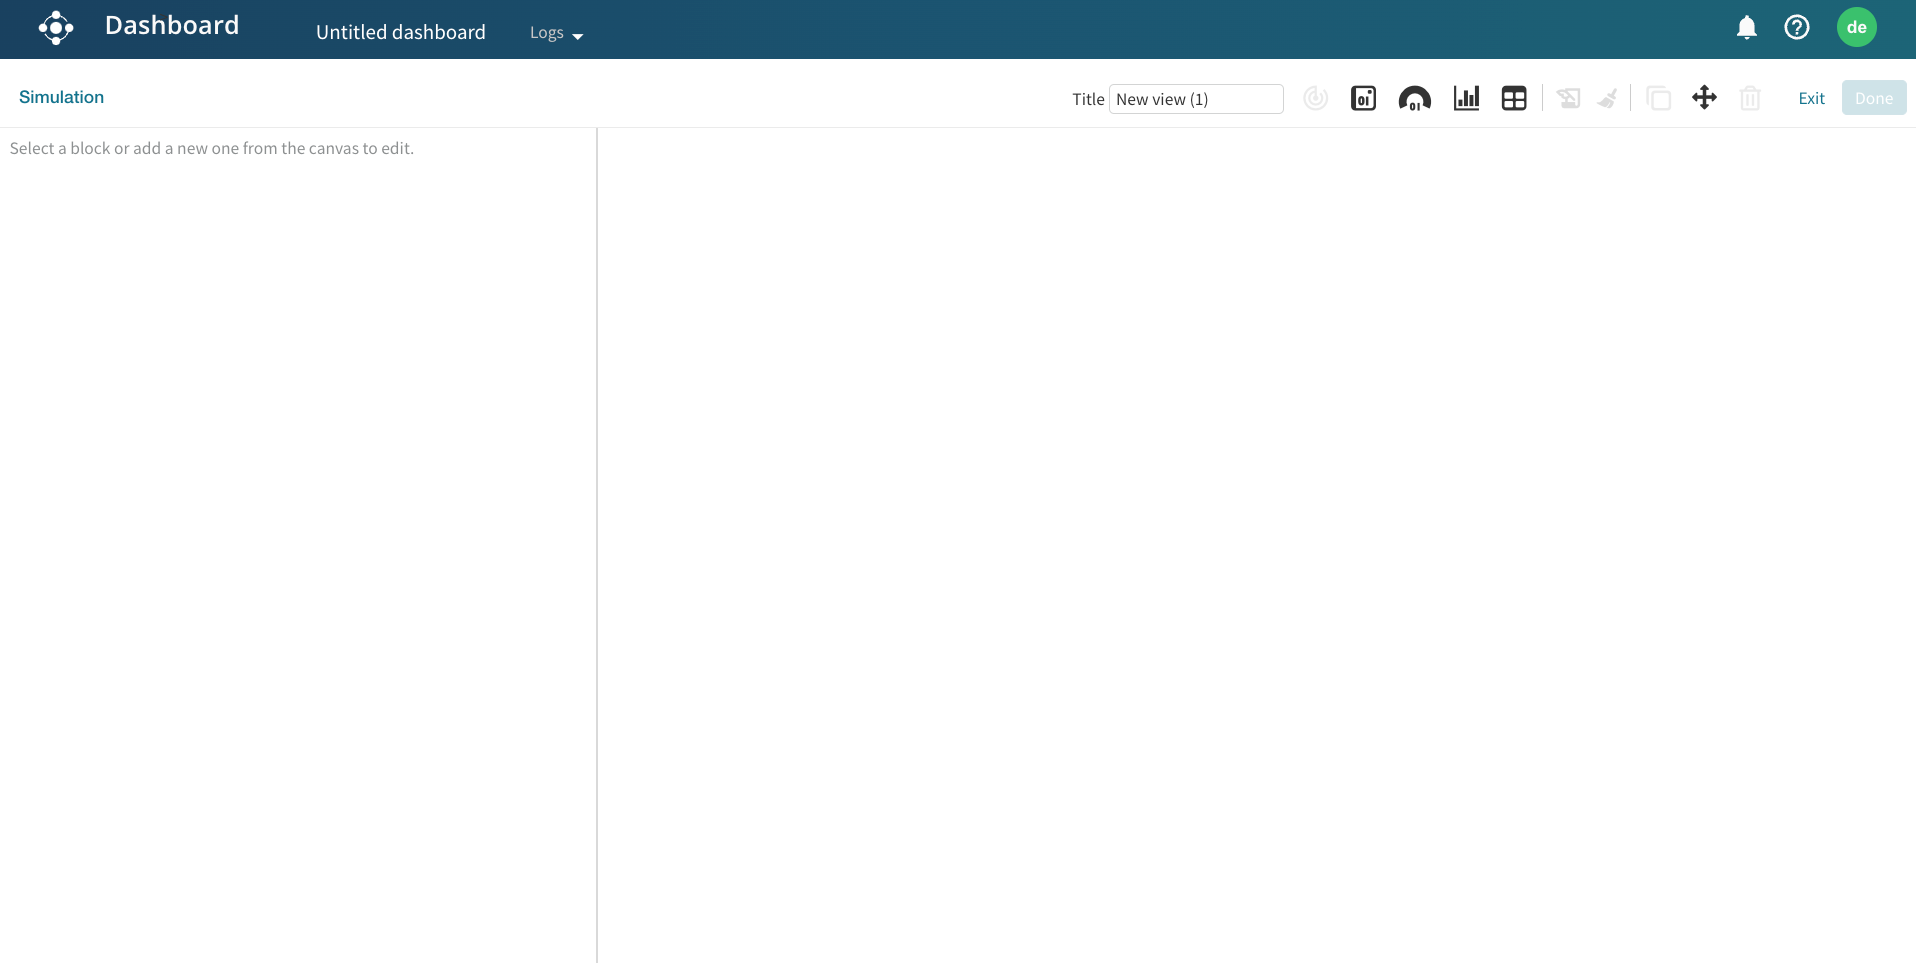
A blank editable view will open up.
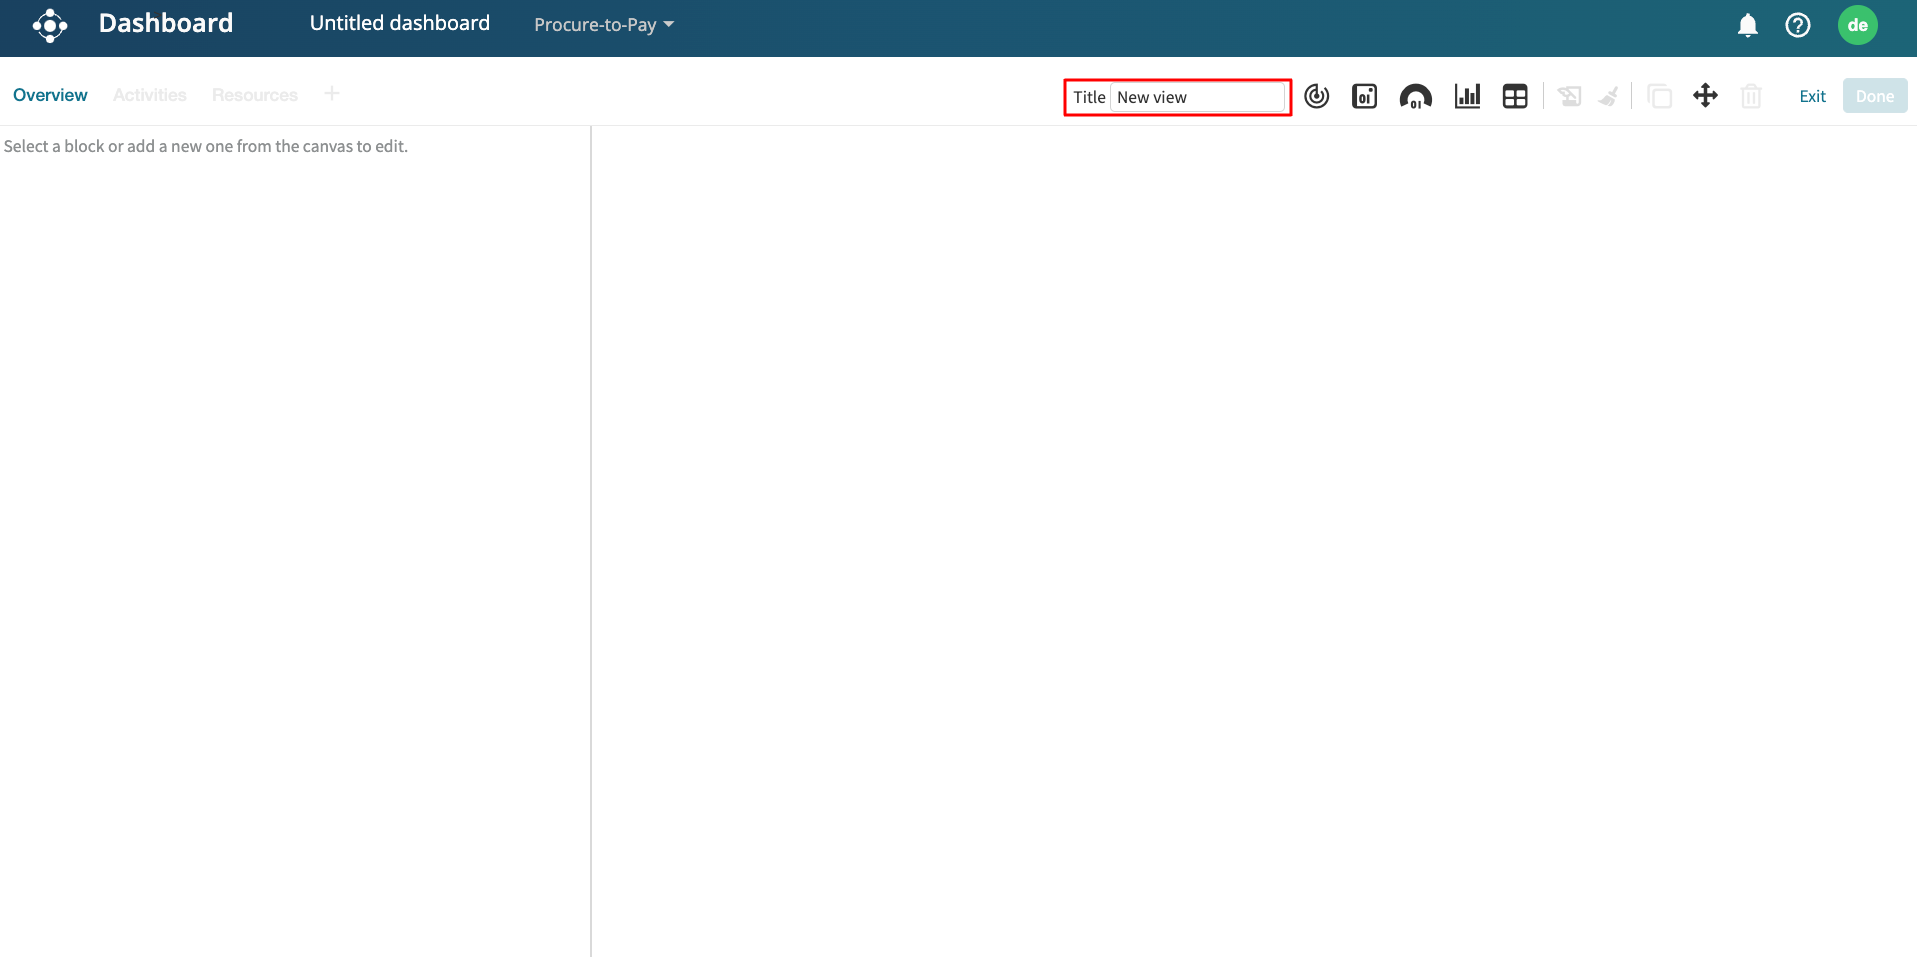
We can change the view’s title by entering the text in the Title text field.
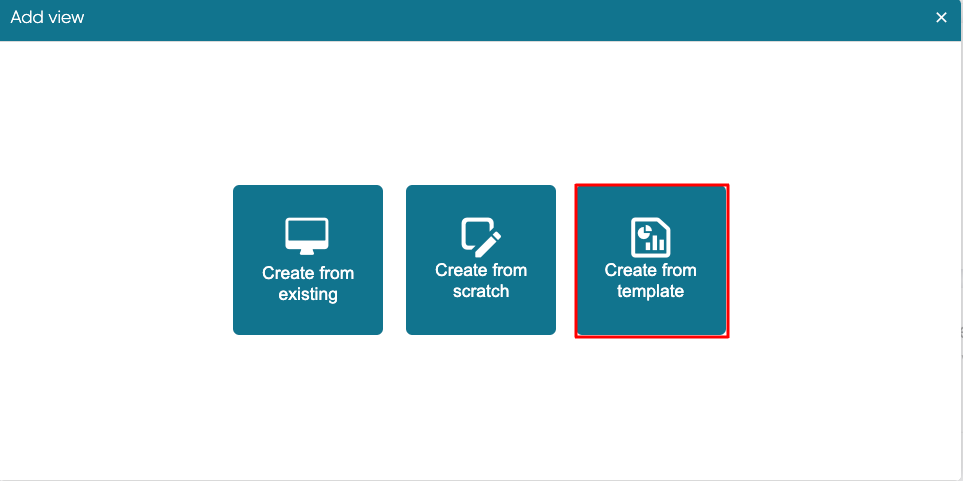
Create from template
If we have a saved dashboard template, we can create a new view from that template. Click Create from template.
This displays the list of saved templates in our instance. If we have the template saved in our local computer (as a JSON file), we can upload it by clicking Upload.
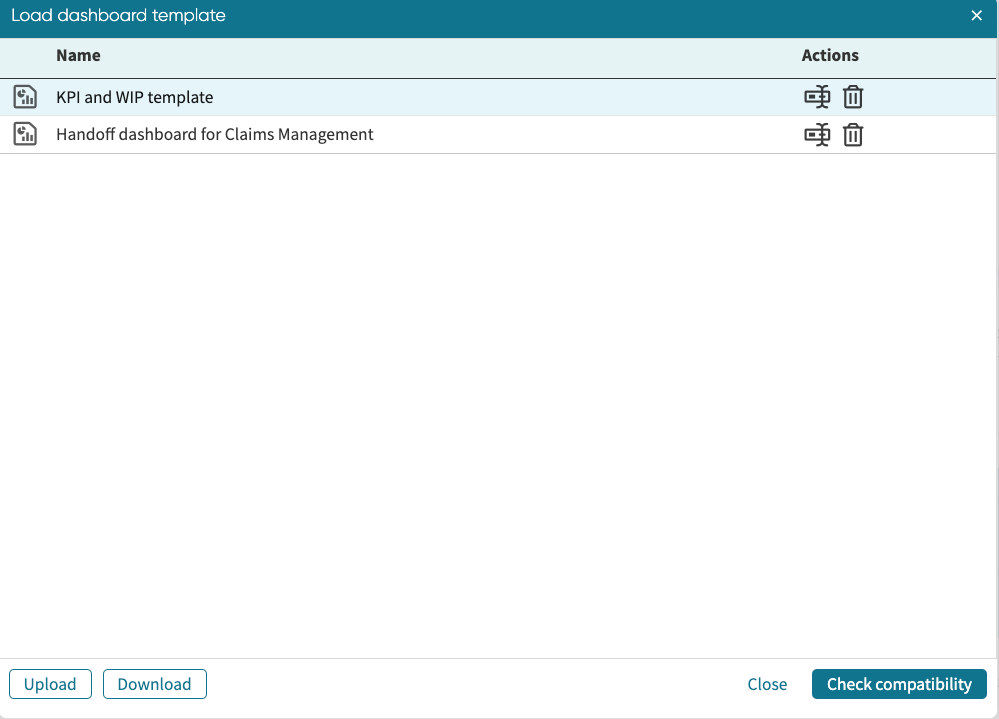
Select the template and click Check compatibility. Apromore maps the template with the current log. Click Apply to load the template.
To learn more about applying a template, see Apply dashboard templates.
Create multi-process dashboards
If a business contains multiple processes with specific nuances, it is useful for business stakeholders to create a comparative dashboard that displays the performance statistics of the processes together. This helps in benchmarking and can also reveal inefficiencies in certain processes. We can create a multi-process dashboard that displays the performance statistics of multiple processes in one view.
Imagine we have two processes related to business travel. One process captures the travel permit process, where employees make a request for a business trip alongside a budget. The other is a travel declaration, where employees declare the amount spent on the trip. We may build a dashboard that monitors both processes simultaneously. For instance, we can add tiles that display the total requested amount and the total spent amount.
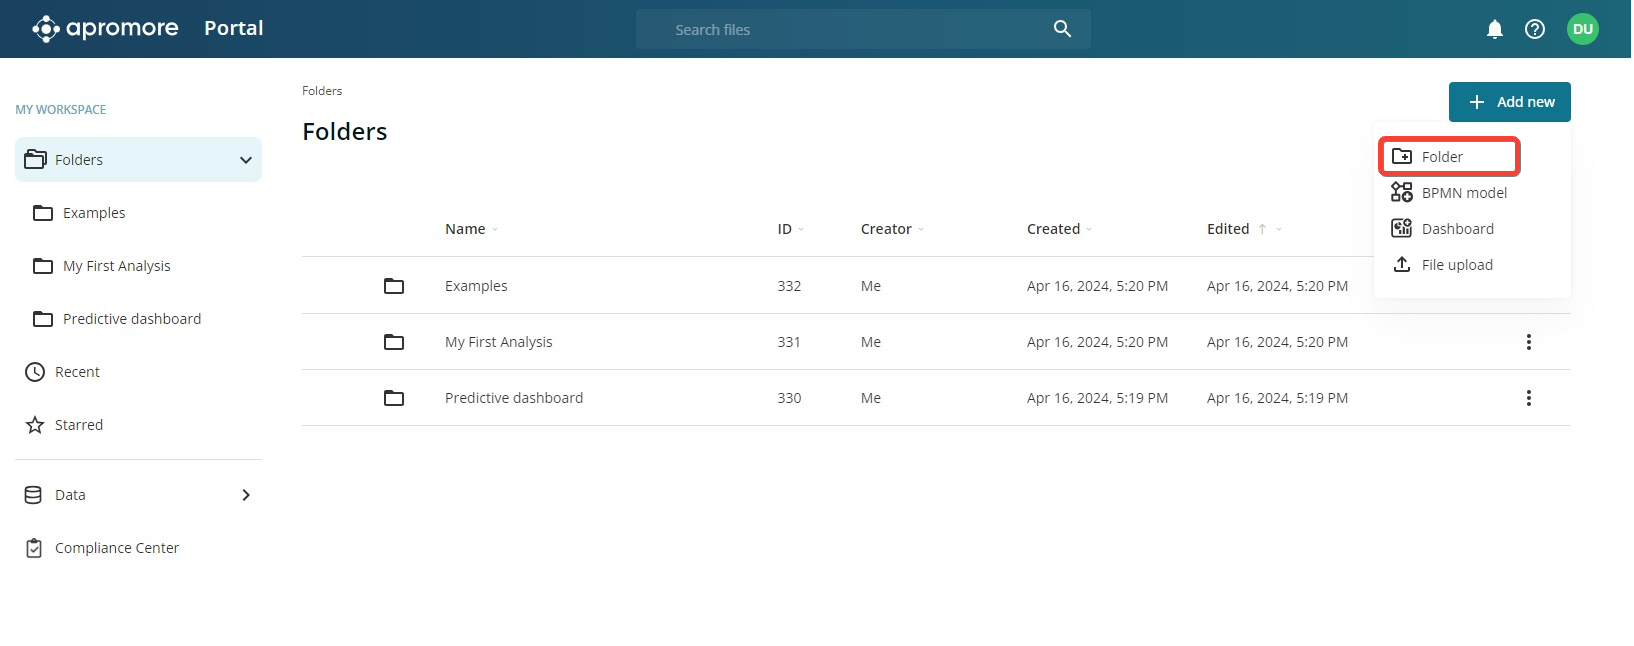
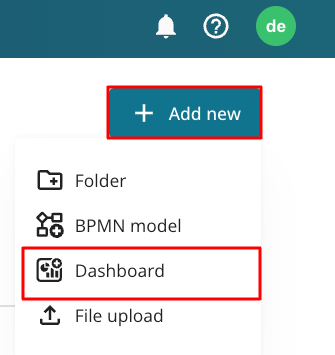
To create such a multi-process dashboard, click Add new > Dashboard from Portal.
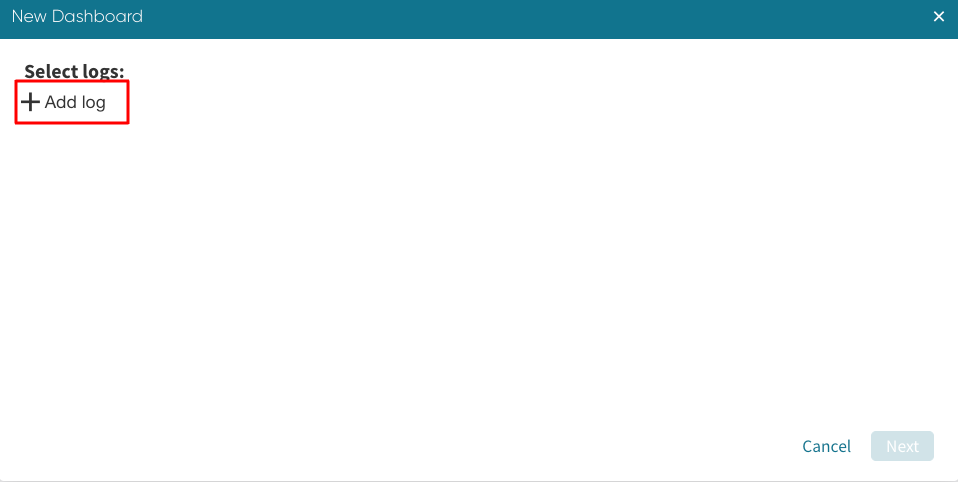
We will be prompted to add the event logs for the processes. Click Add log to add a log.
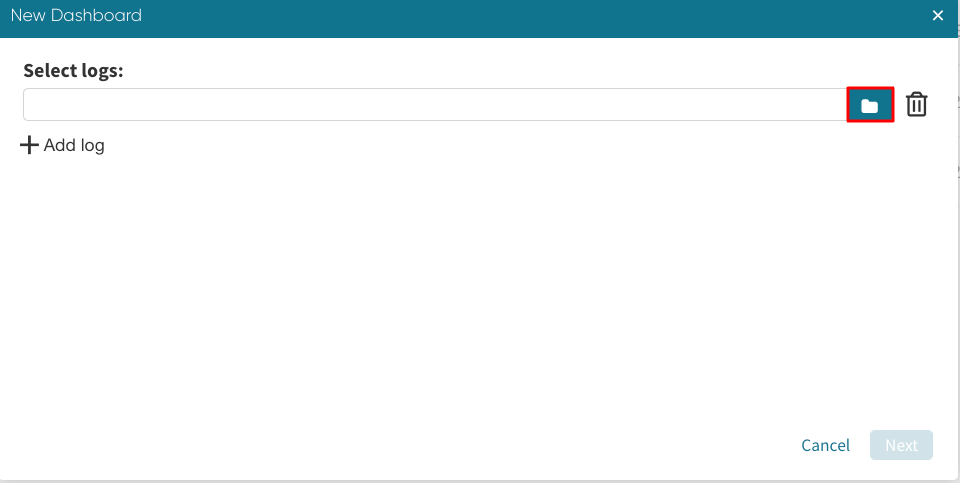
Click the Folder icon to select a log from our Apromore Workspace.
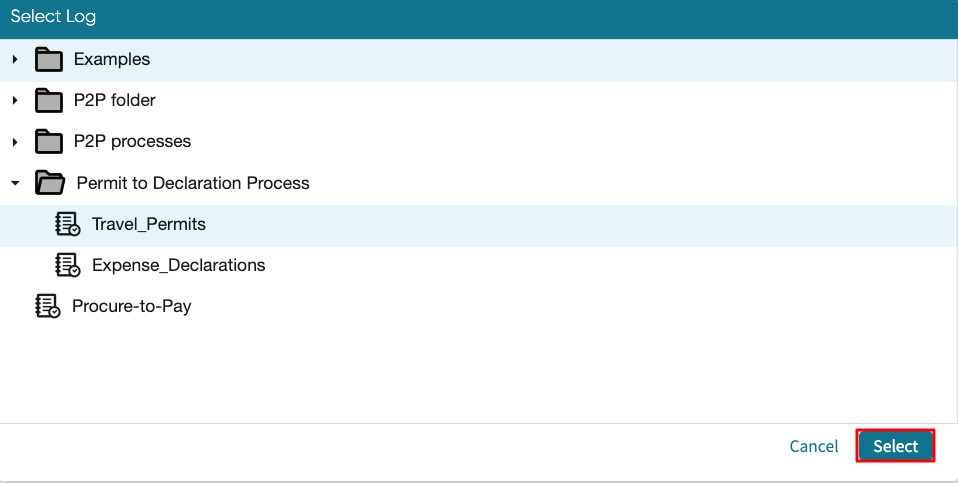
Select the log and click Select.
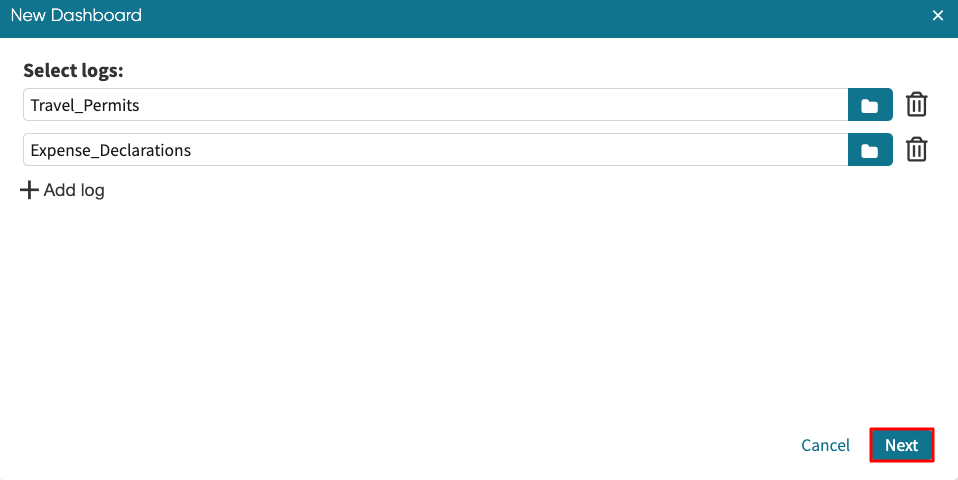
Click Add log and repeat the same steps to add the second log. After adding the logs, click Next.
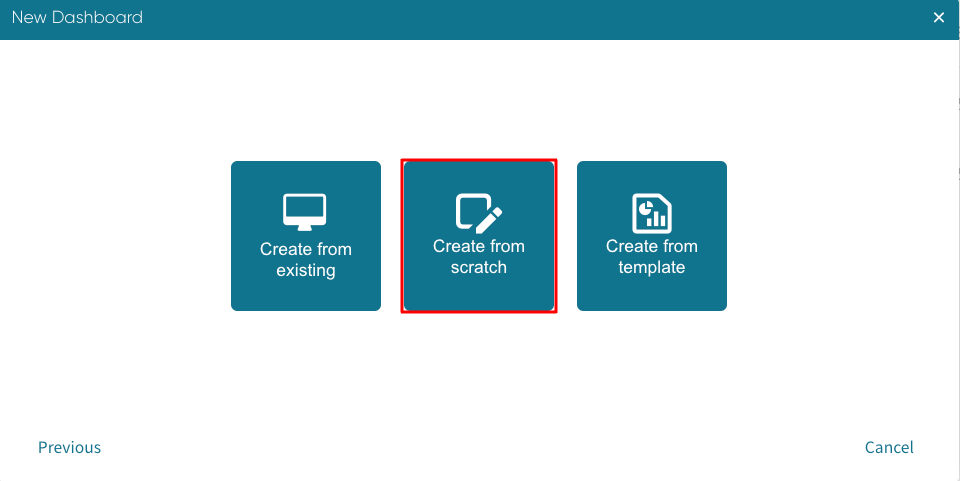
We can either create the dashboard from an existing dashboard, from scratch, or from a template. For our illustration, we click Create from scratch.
This creates a blank dashboard where we can add different tiles, KPIs, tables, or charts.
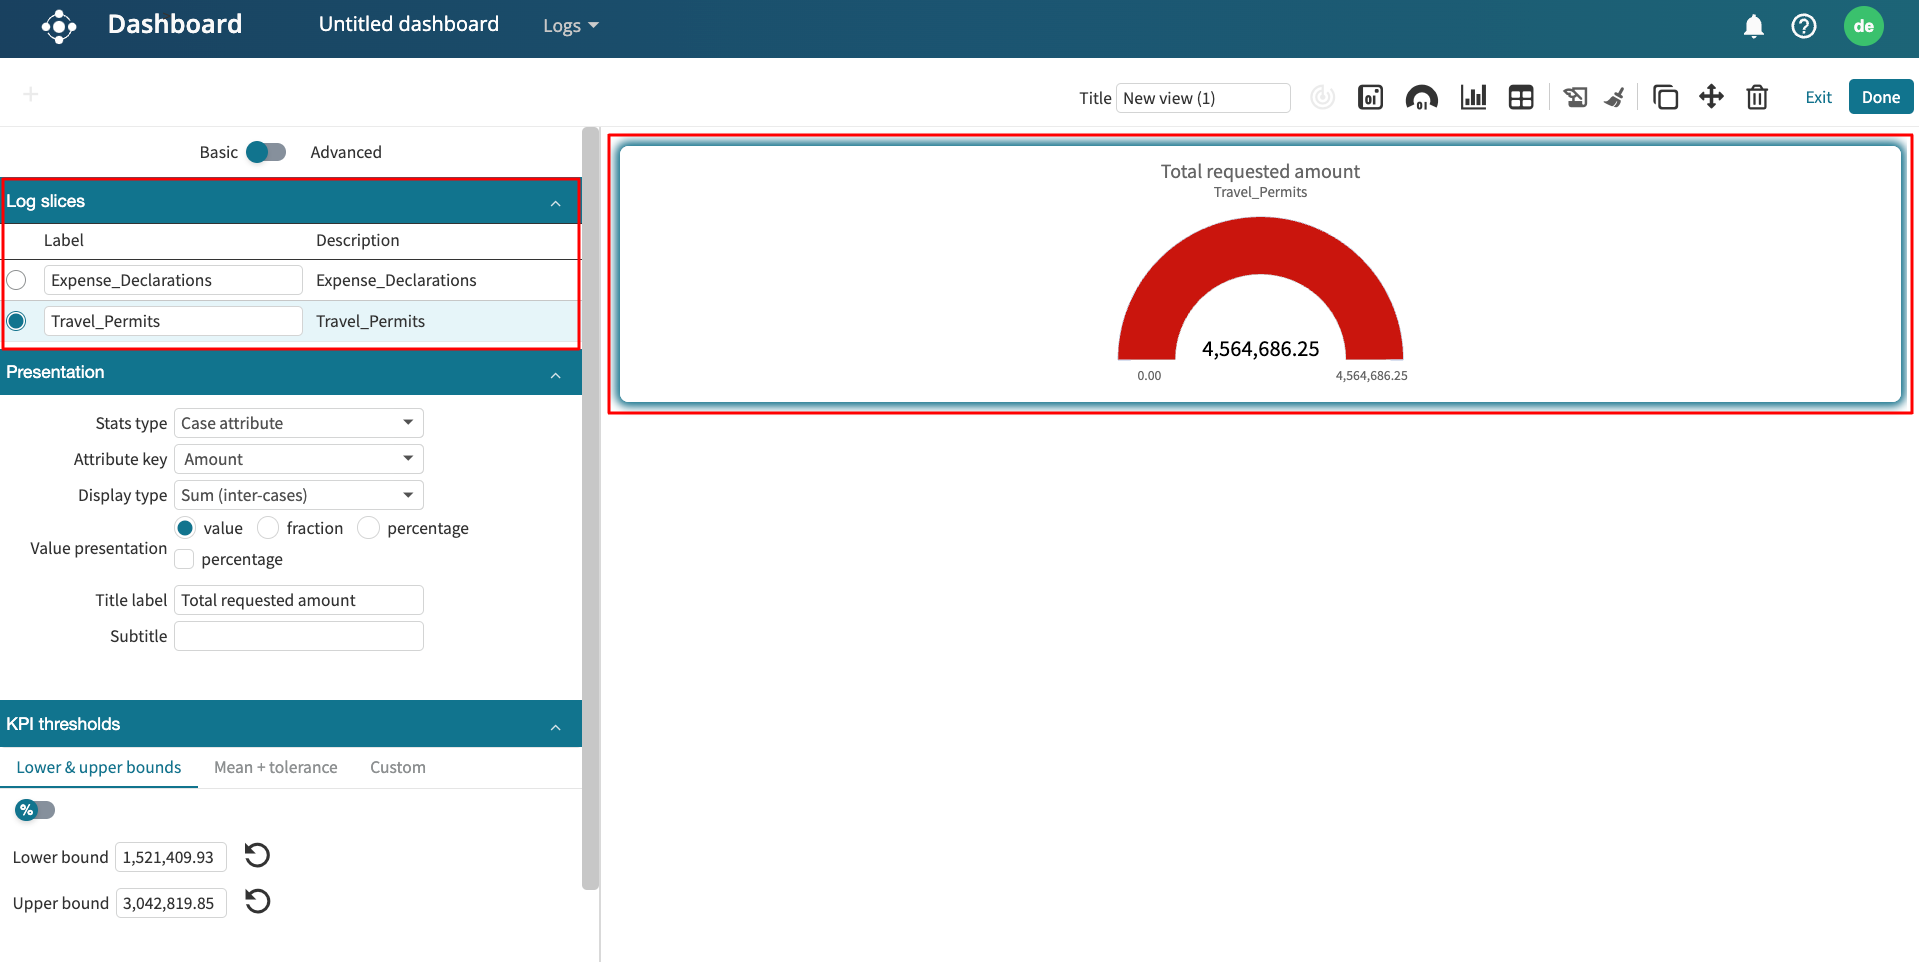
To display the total requested amount tile, click the respective log from the Log slices section. We use the “Amount” column for both event logs and select “Sum (inter-cases)” display type to display the total value.
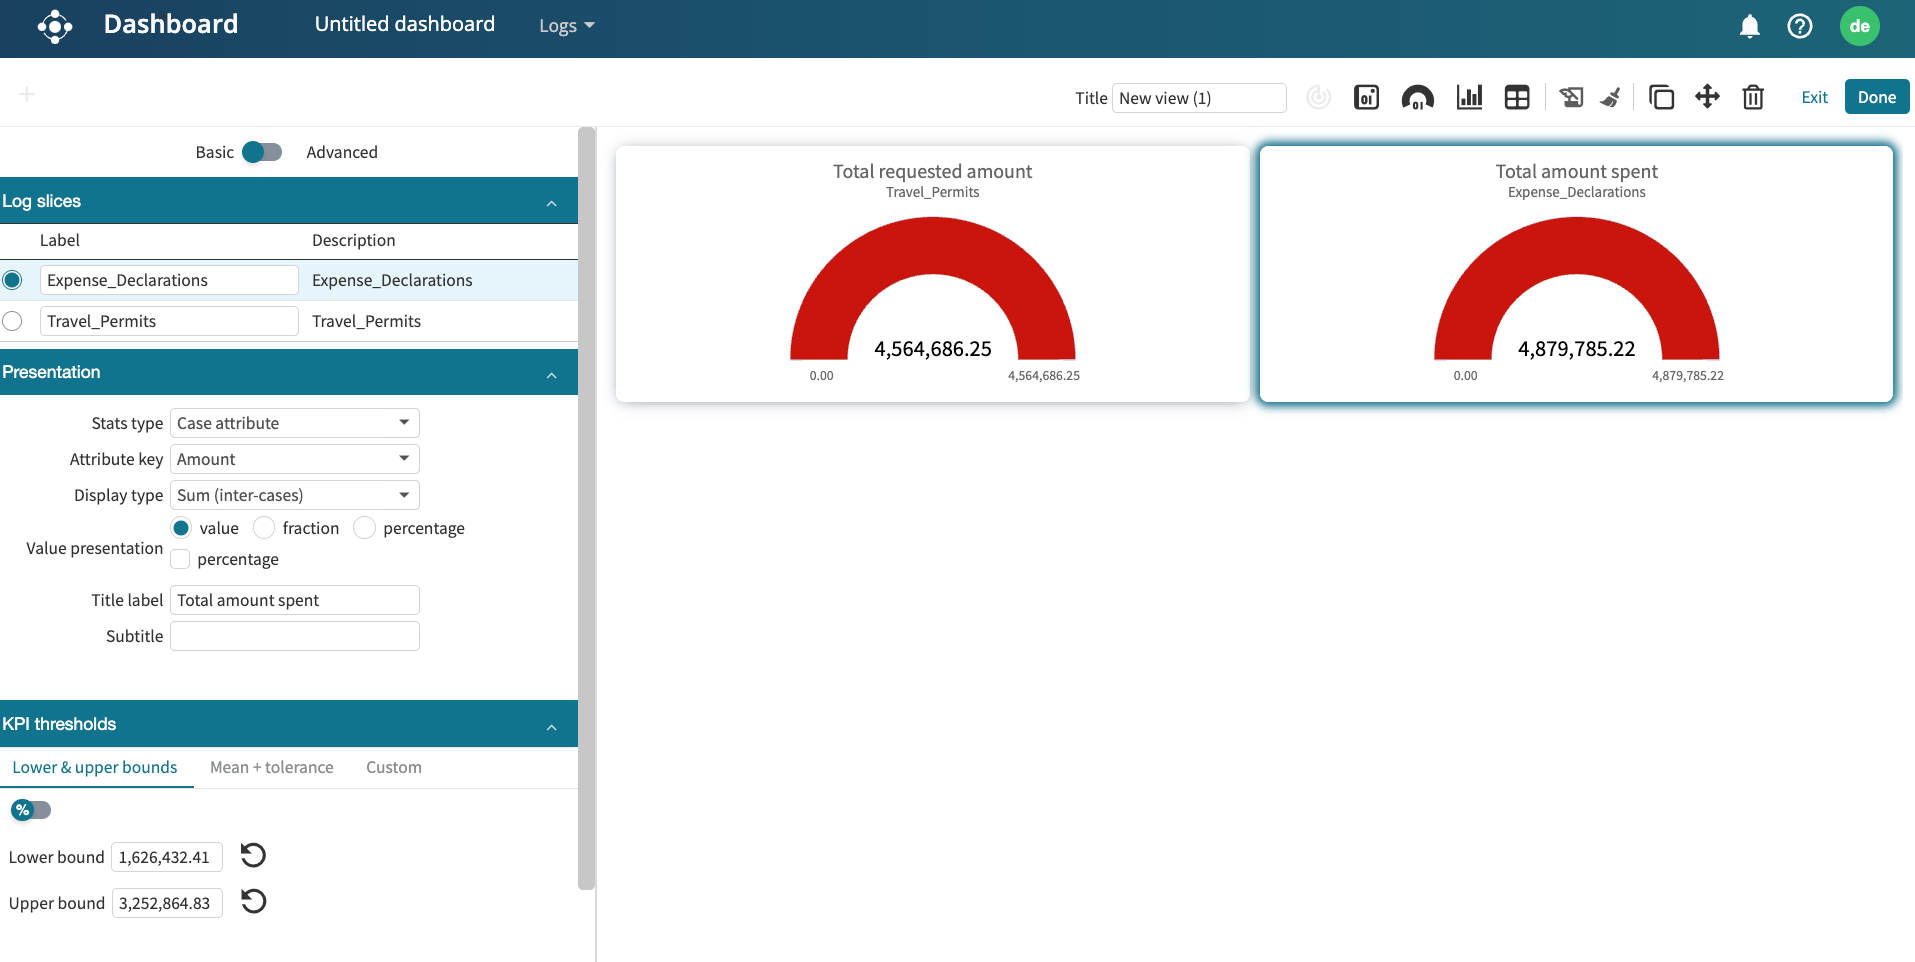
Add the second tile that displays the total amount spent. We repeat the same process, but this time, we select the expense declaration log.
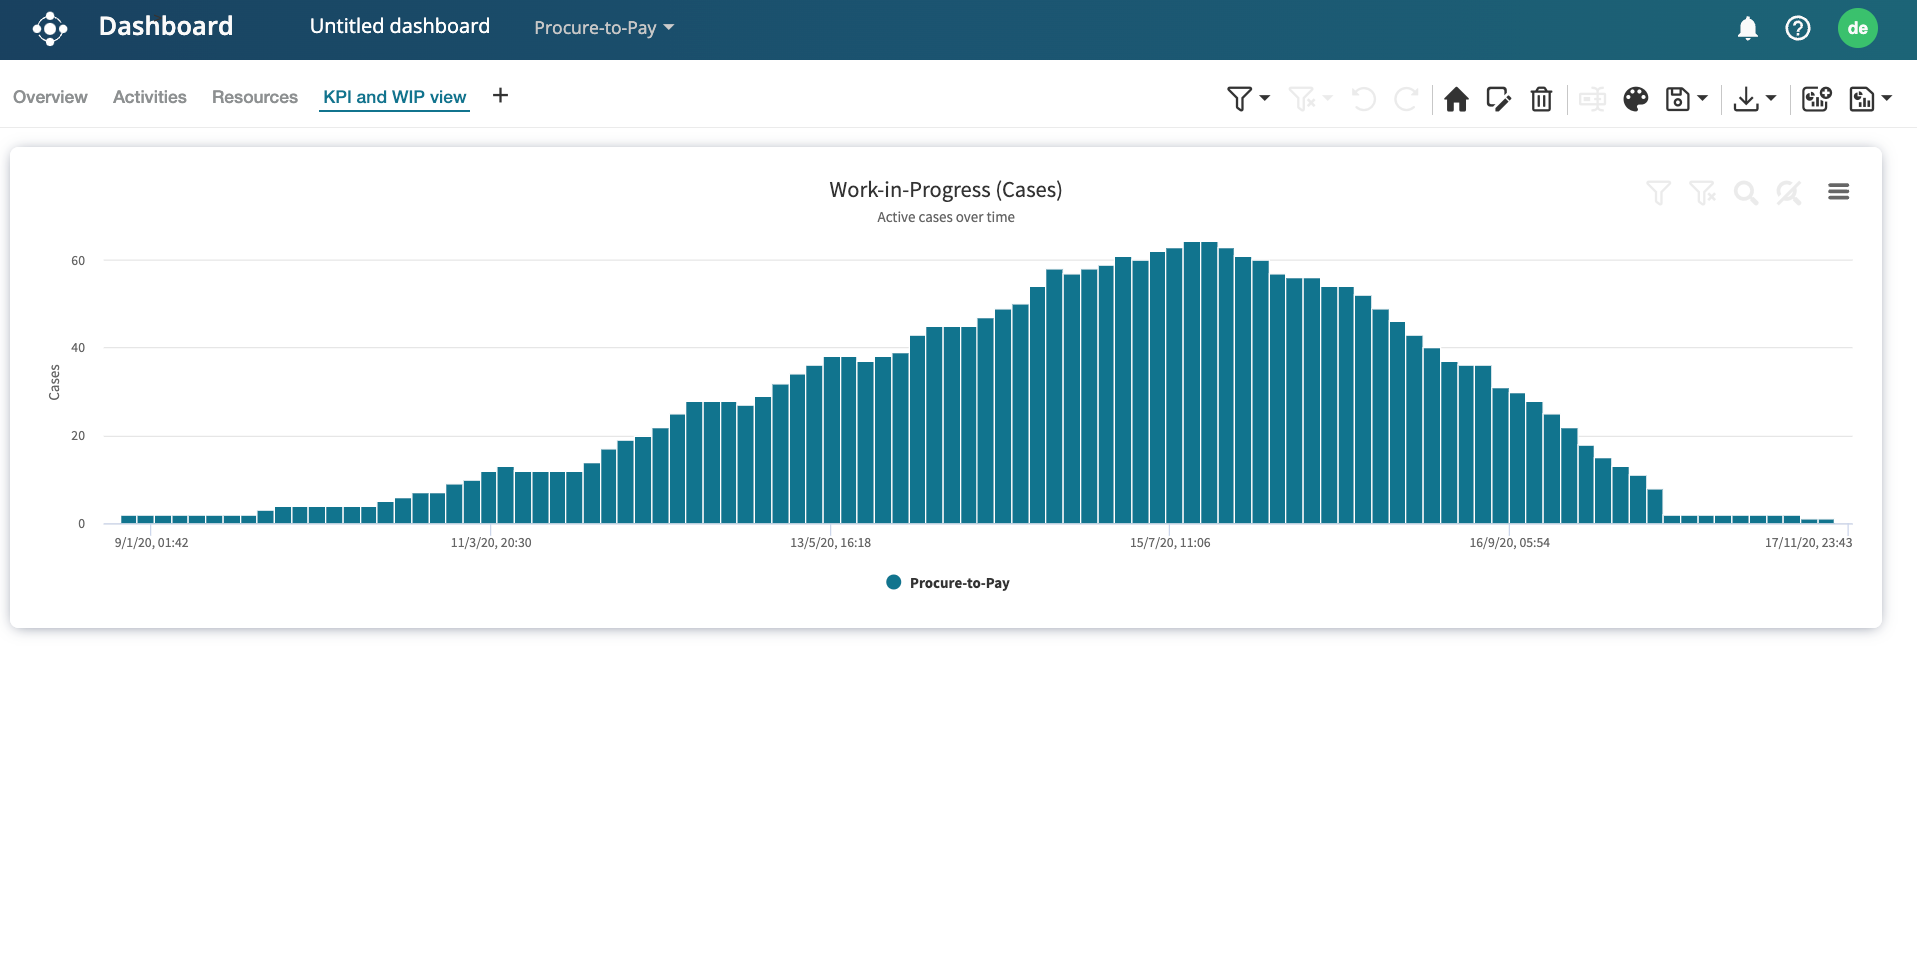
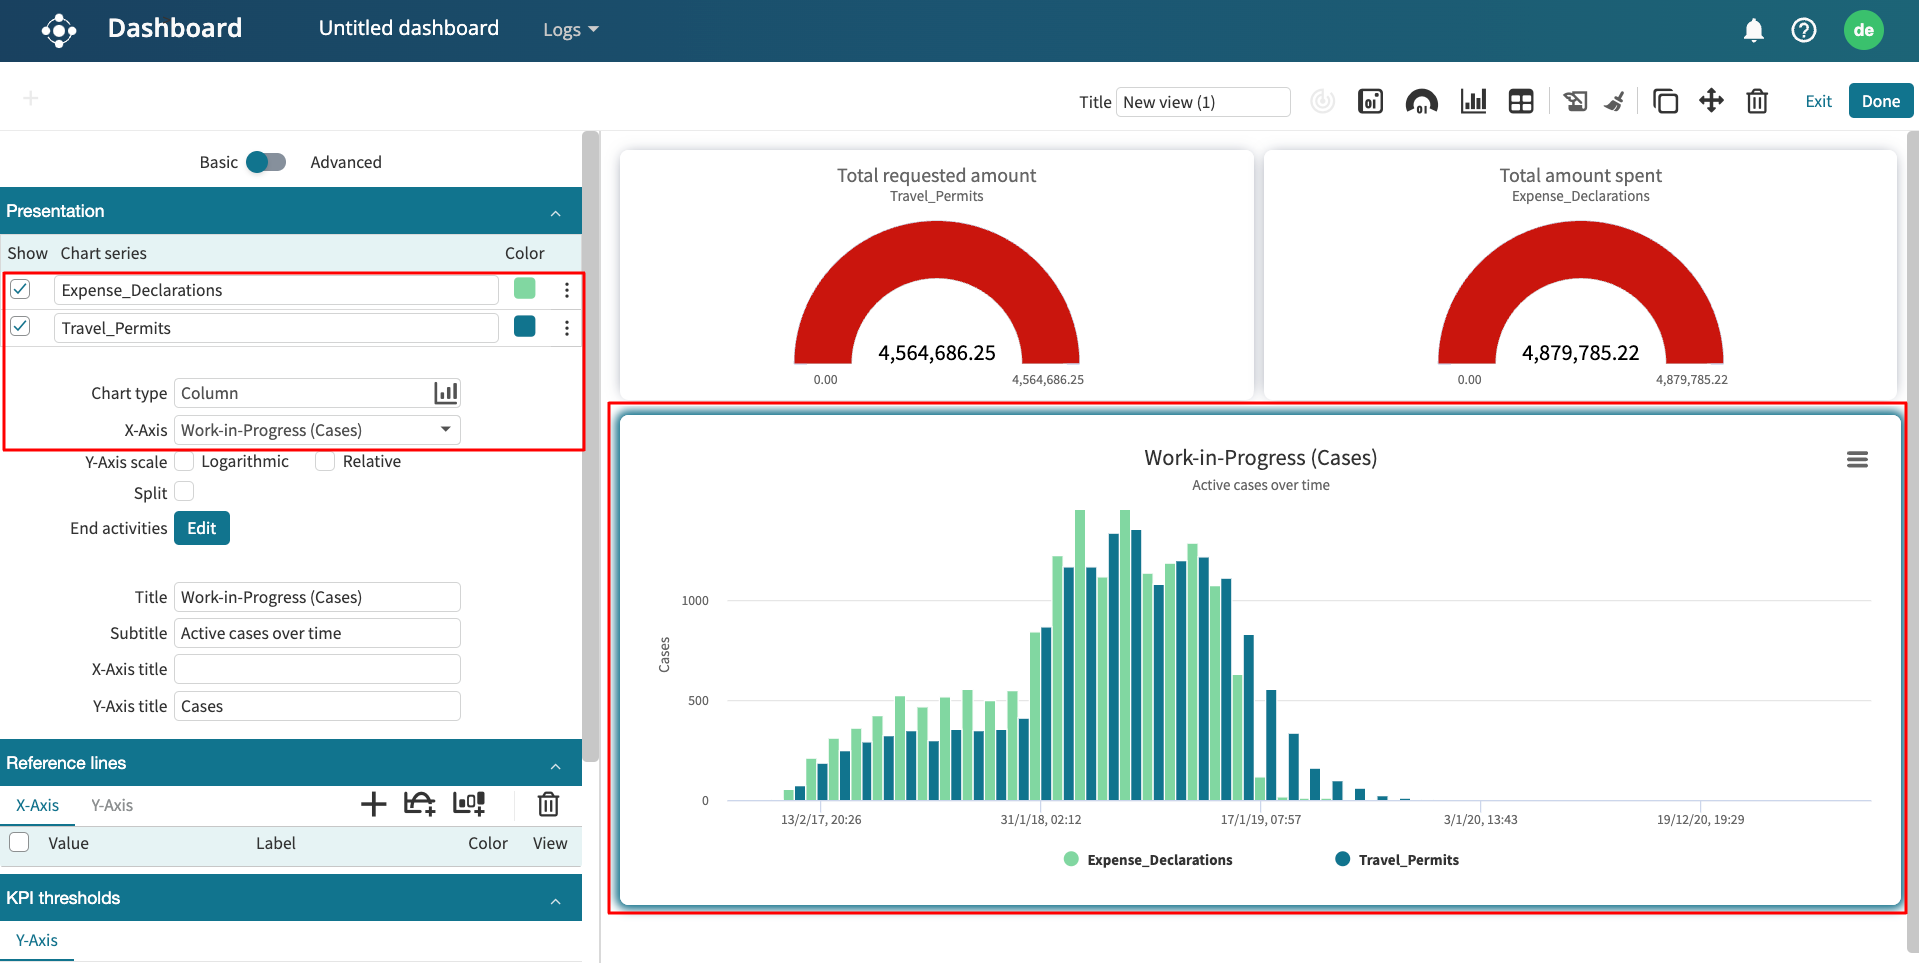
We can also add a chart that displays the number of travel permits vs the number of declared expenses over time. We simply create a Work-in-Progress (Cases) chart and select both event logs.
Tip
Multi-process dashboards can also be used to create dashboards for as-is and what-if scenarios during process simulation.