Add tables to dashboard
Apromore Dashboard also allows users to visualize aggregate statistics of an event log in tabular form. To do this, we need to add a table to a dashboard.
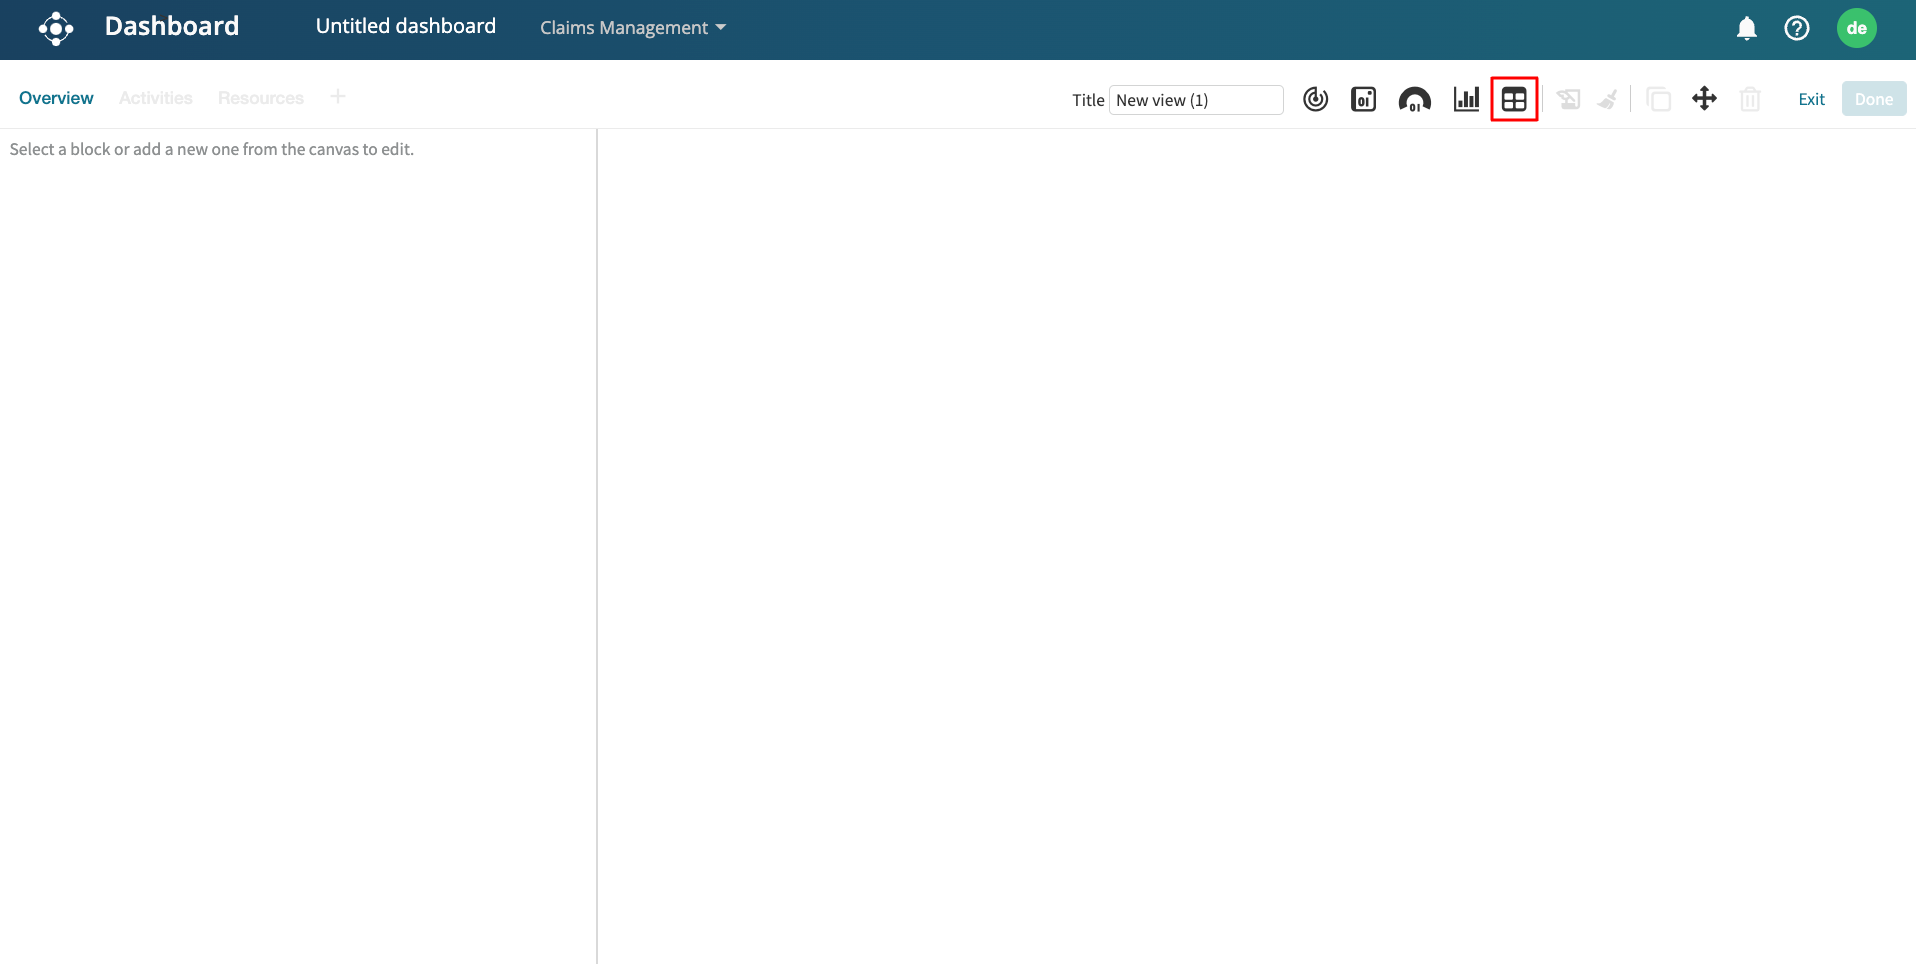
From Portal, select an event log and launch a dashboard. Click the “+” sign in the top-left corner to add a new view from scratch. Click the Add new table icon to add a new table.
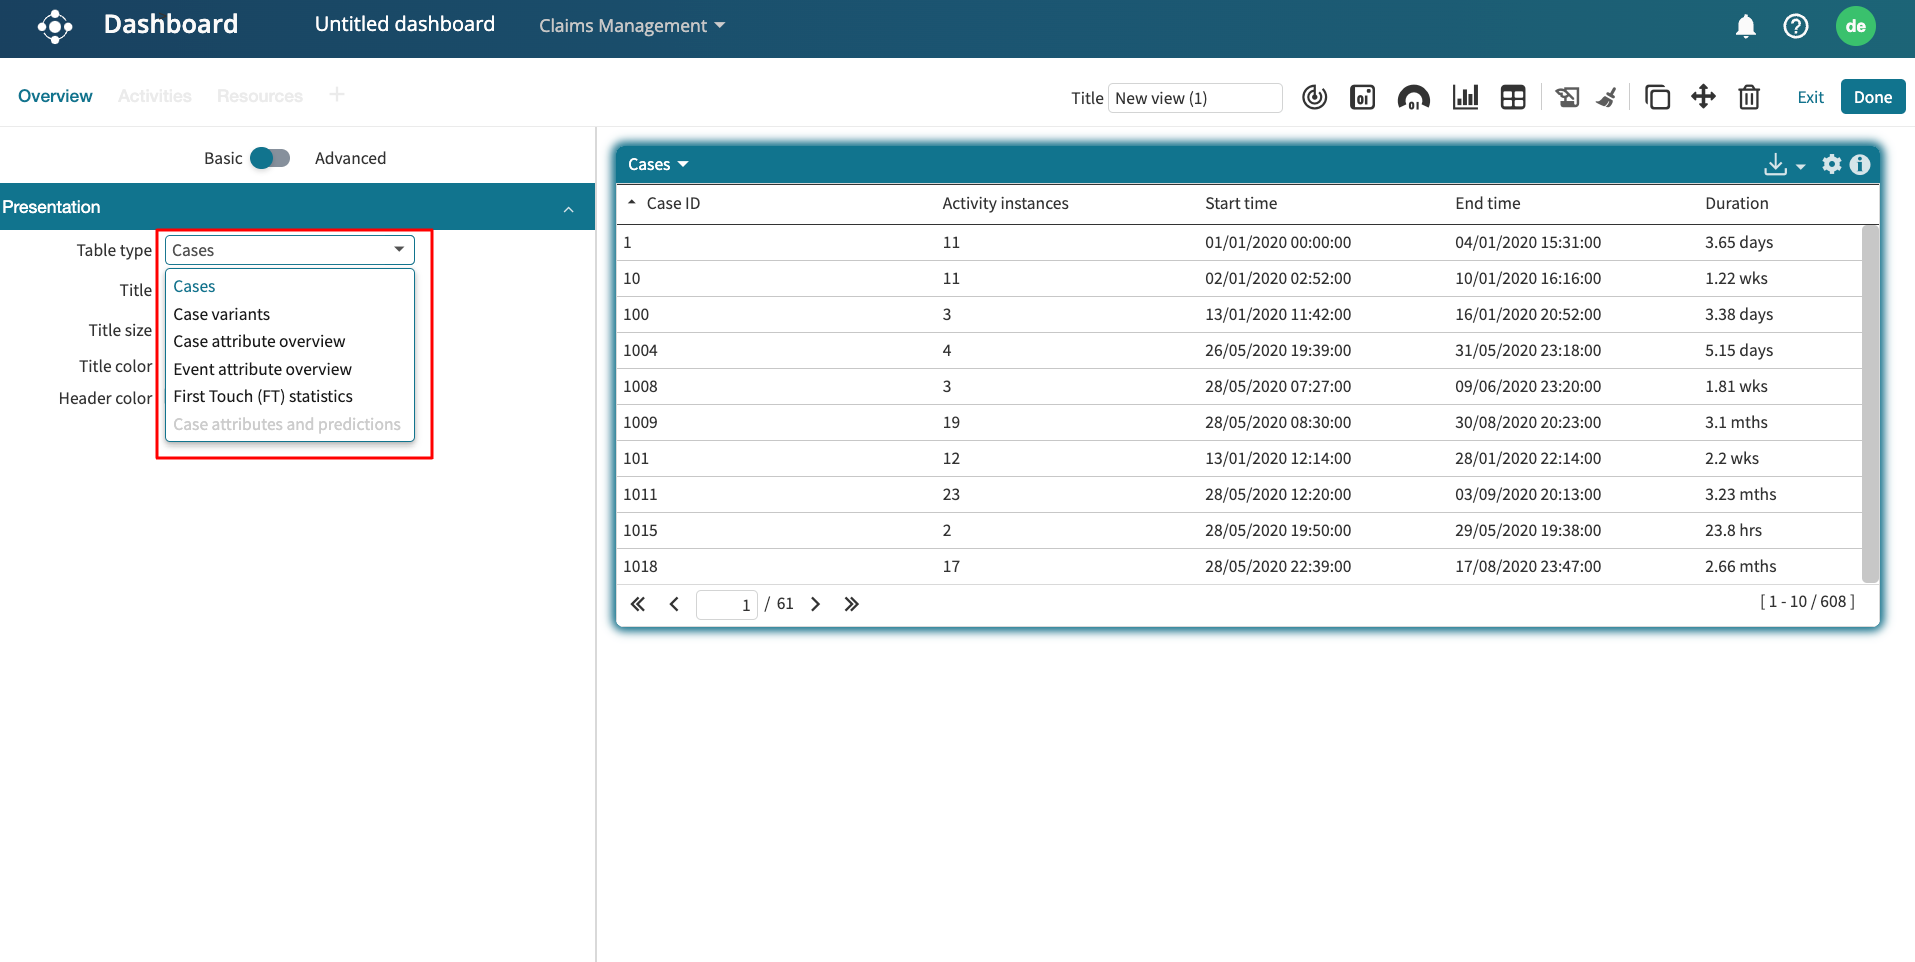
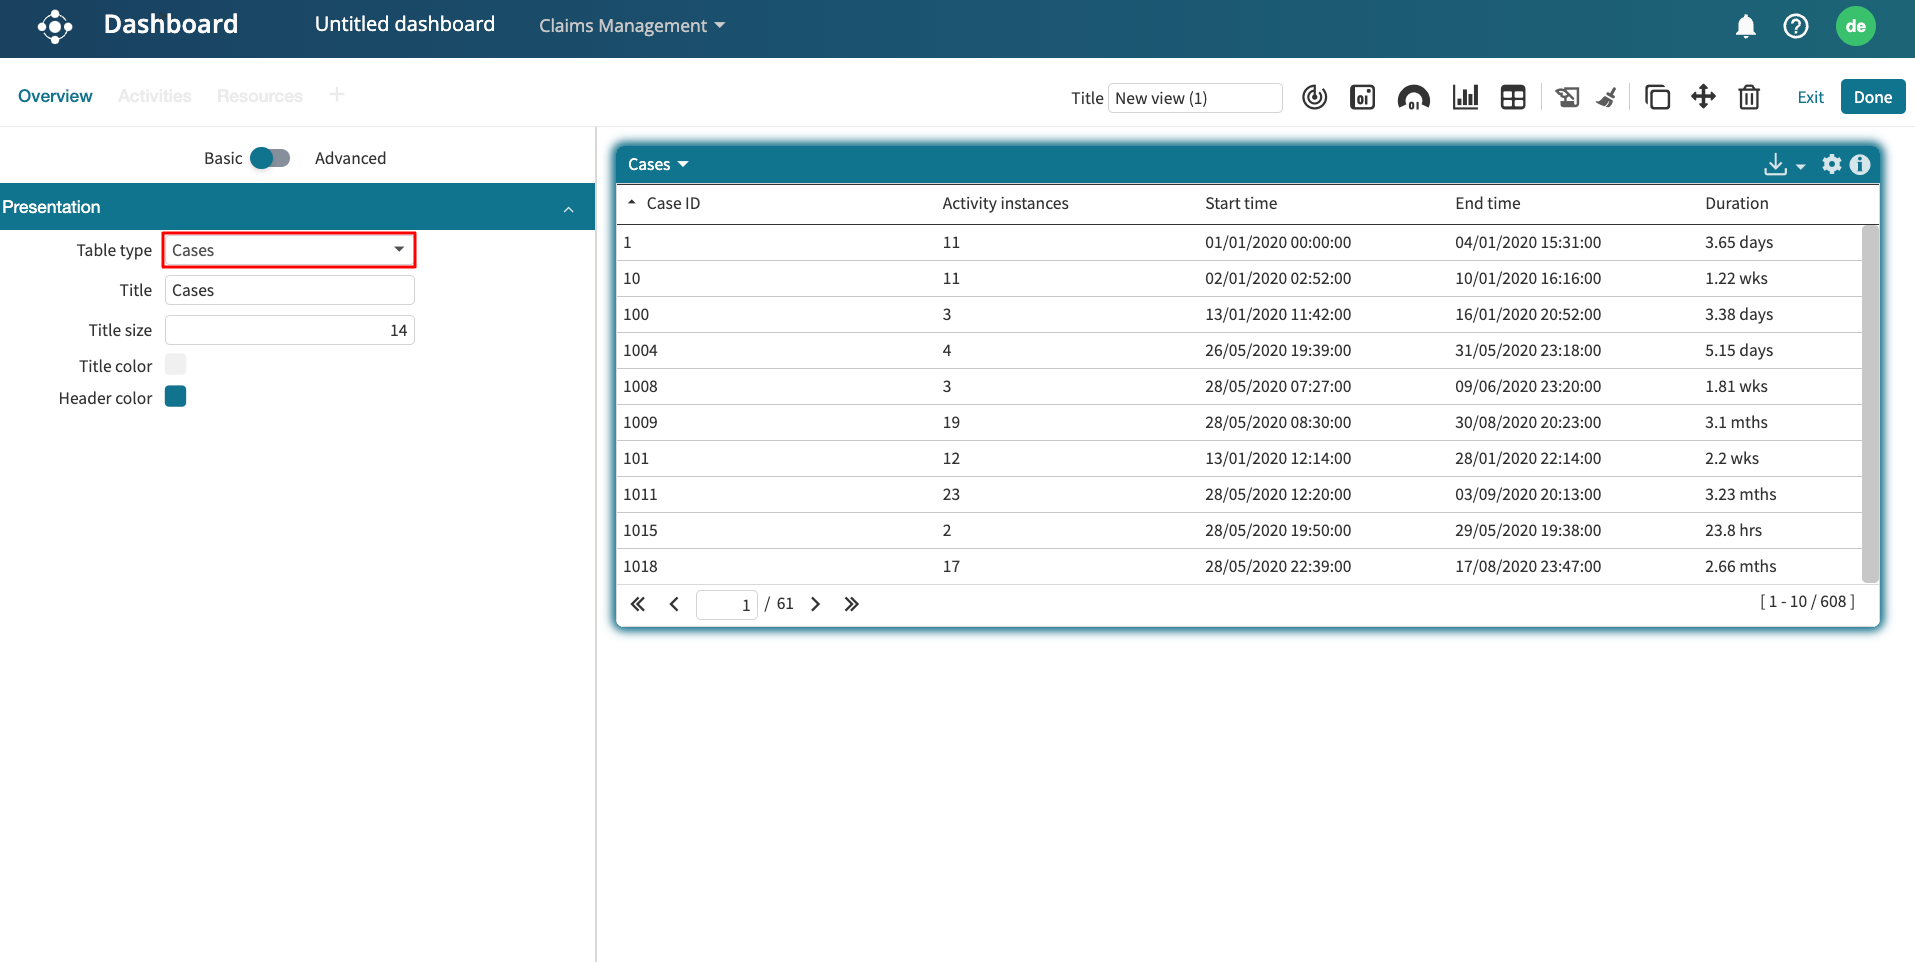
A default case table is generated. Click on the table to edit it. Click the Table type dropdown to change the type of table displayed.
Cases table
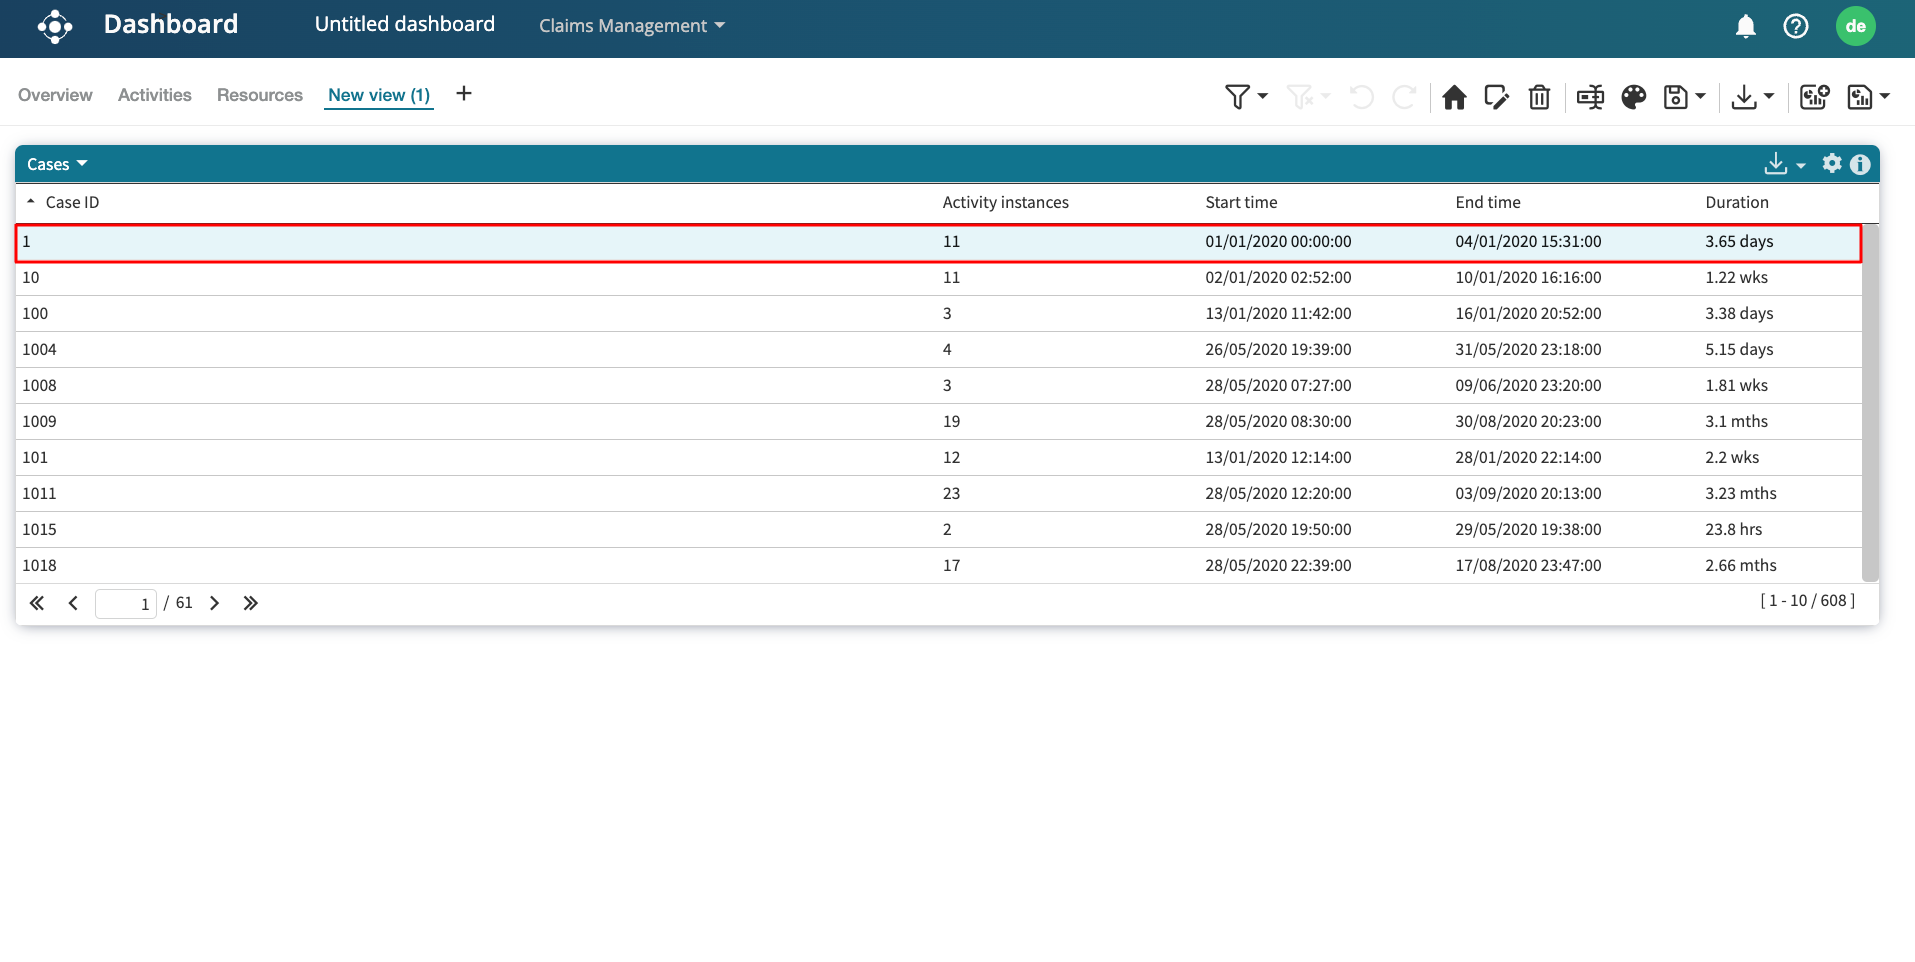
The cases table displays the key statistics of each case in the event log. The properties displayed are:
Case ID: The ID of the case.
Activity instances: The number of activities in the case.
Start time: The timestamp of the first activity in the case.
End time: The timestamp of the last activity in the case.
Duration: The time between the first activity and the last activity.
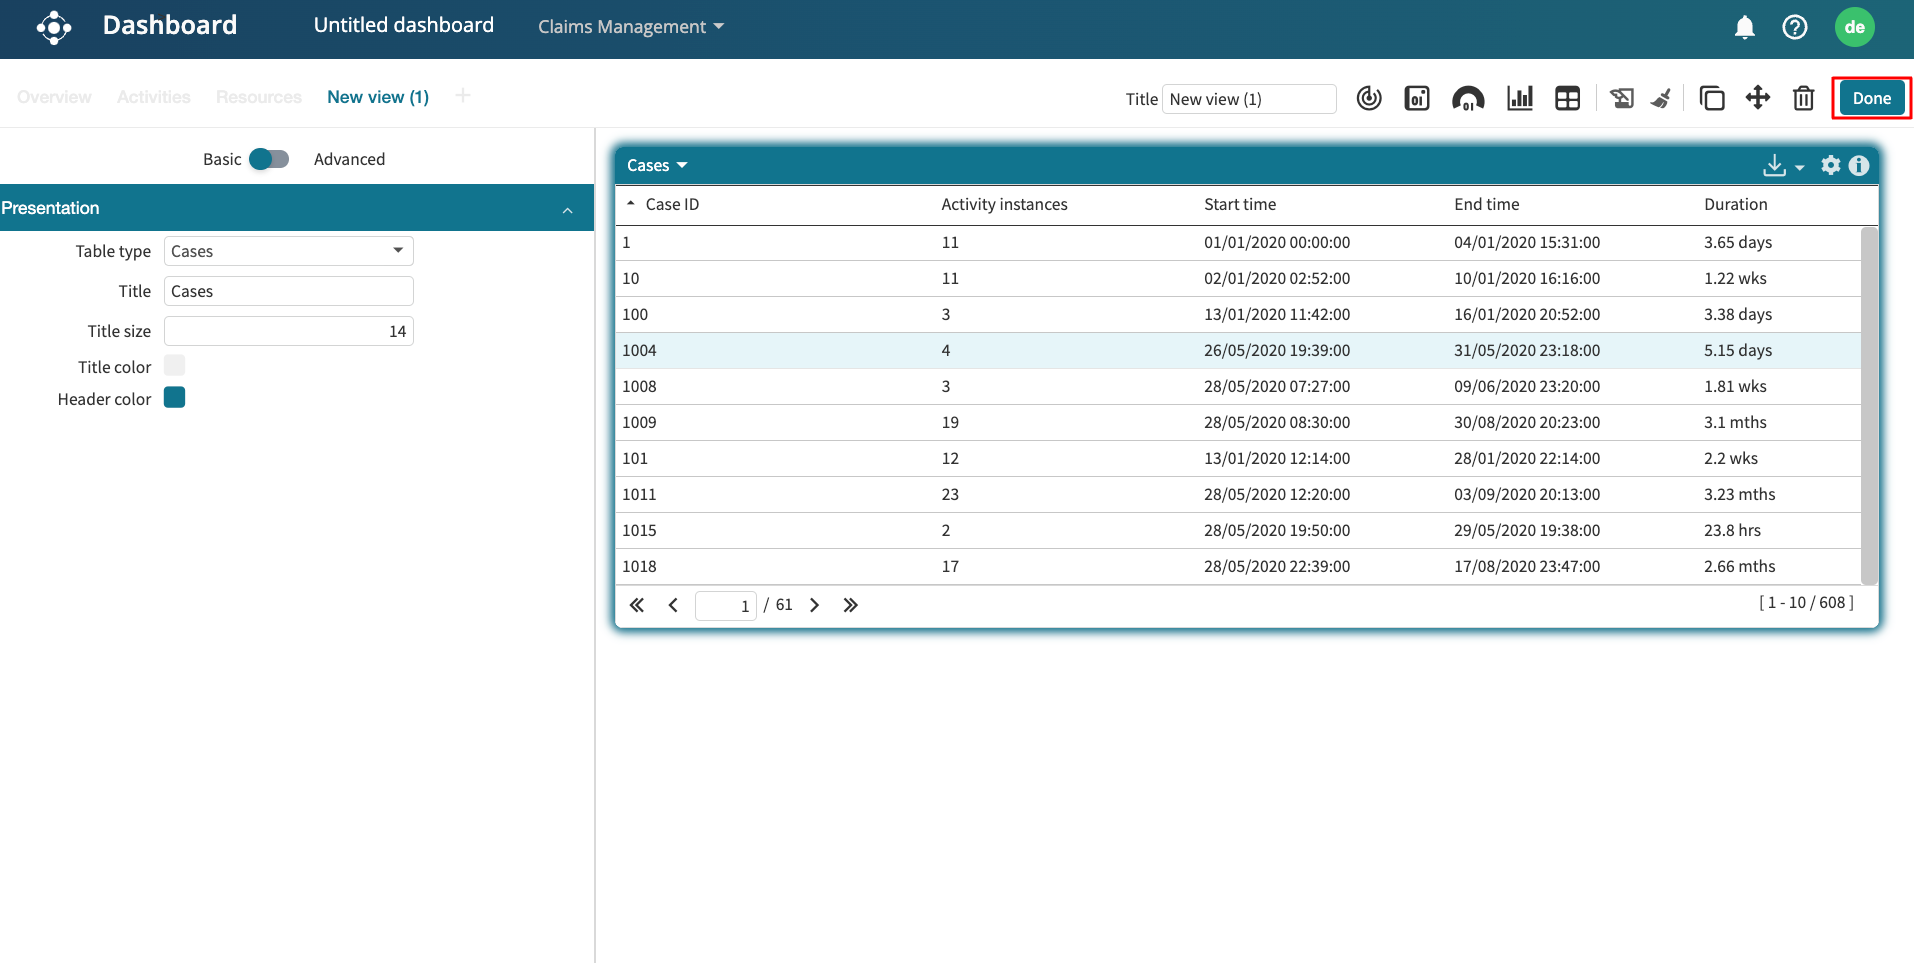
When a case table is in a dashboard, we can view the case timeline from the case table. Click Done to exit editing mode.
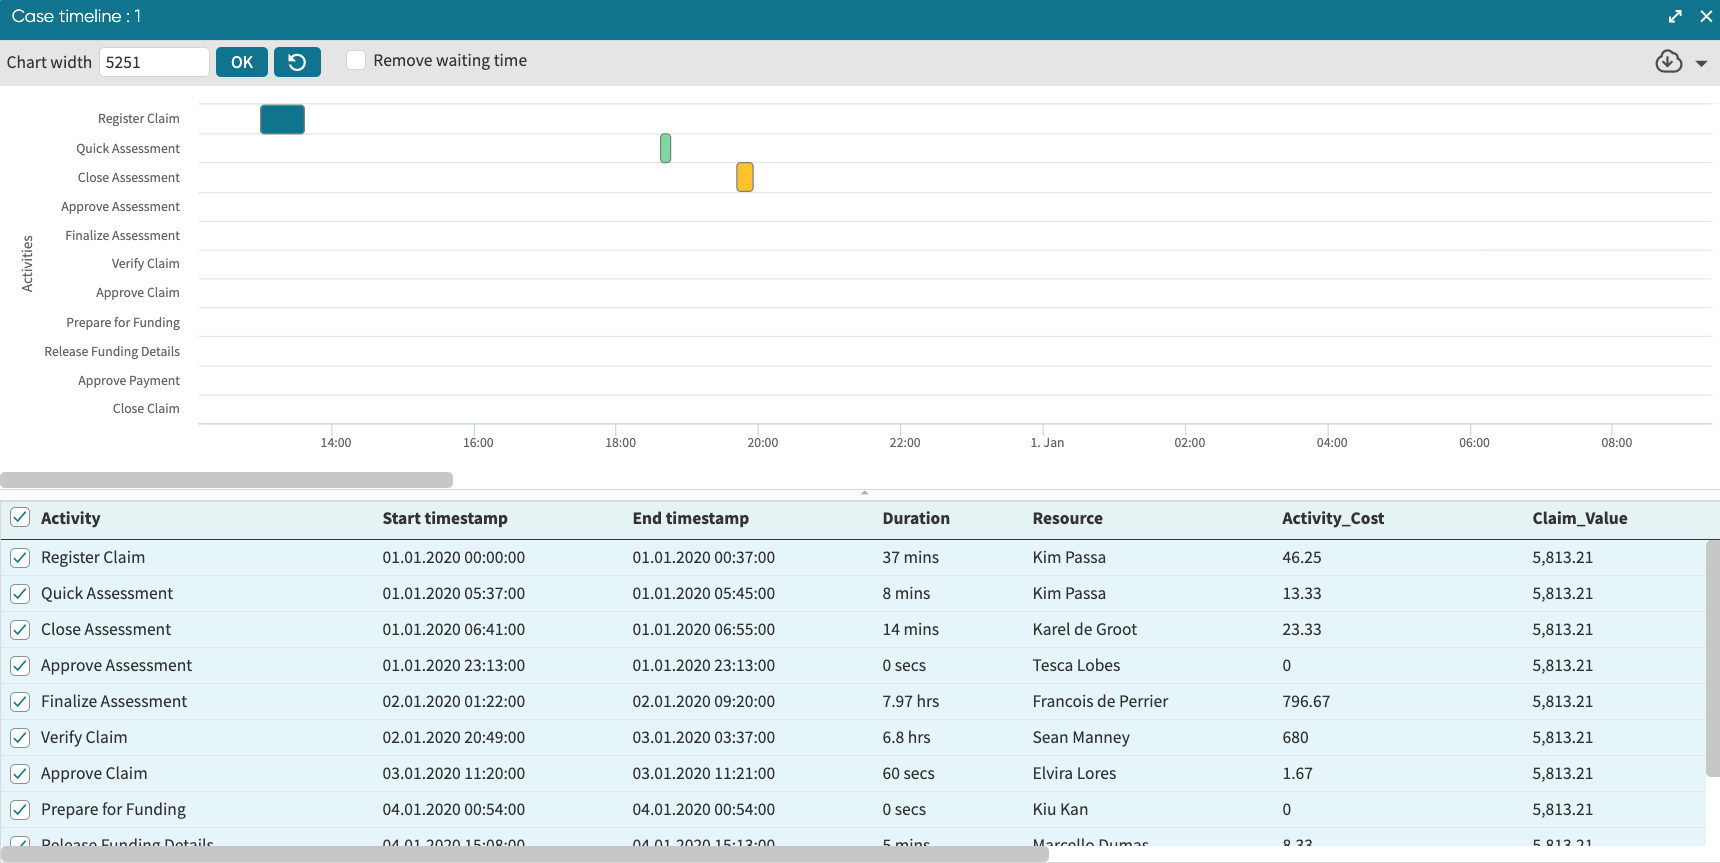
Double-click a case in the case table to display the case timeline.
This displays the case timeline.
Case variants table
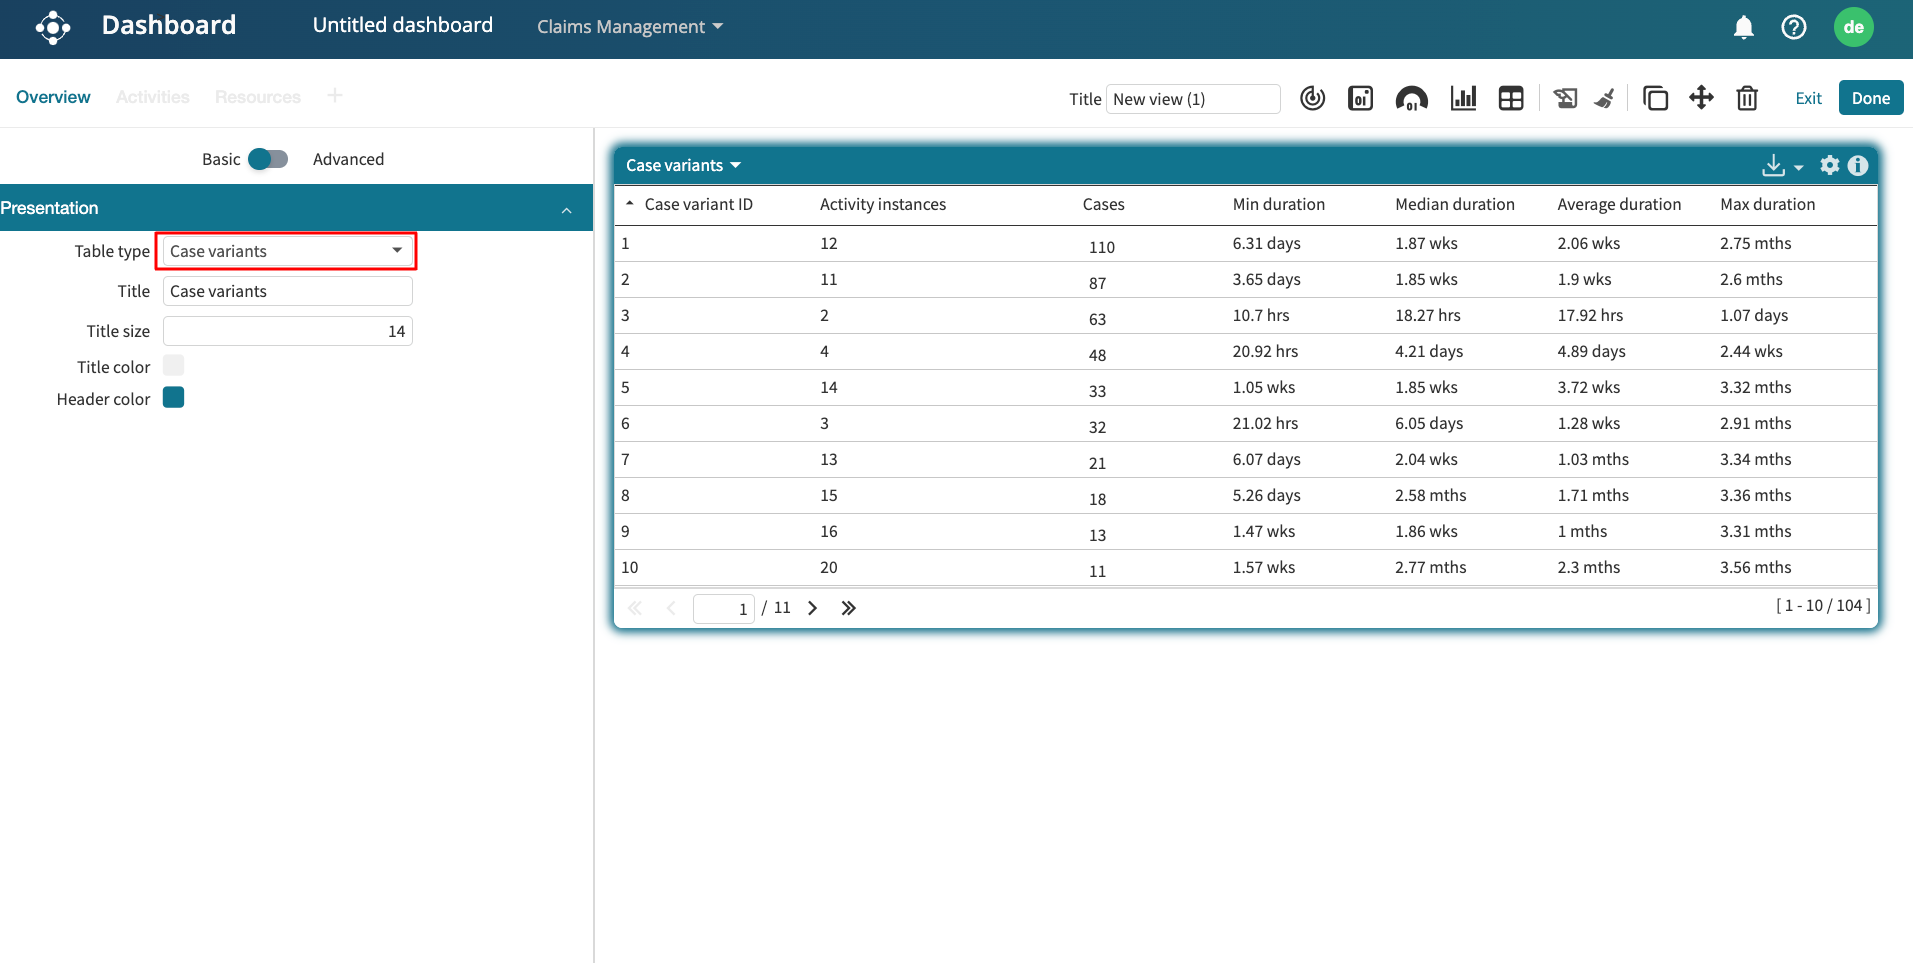
The case variants table displays the statistics for each case variant in the event log. A case variant is a distinct pathway in the sequence of activities. The properties displayed are:
Case variant: A unique ID automatically assigned to every case variant in the log.
Activity instances: The number of activities in the case variant.
Cases: The number of cases in the case variant.
Min duration: The shortest duration within the case variant.
Median duration: The median duration of the cases in the case variant.
Average duration: The mean duration of the cases in the case variant.
Max duration: The longest duration within the case variant.
Case attribute overview table
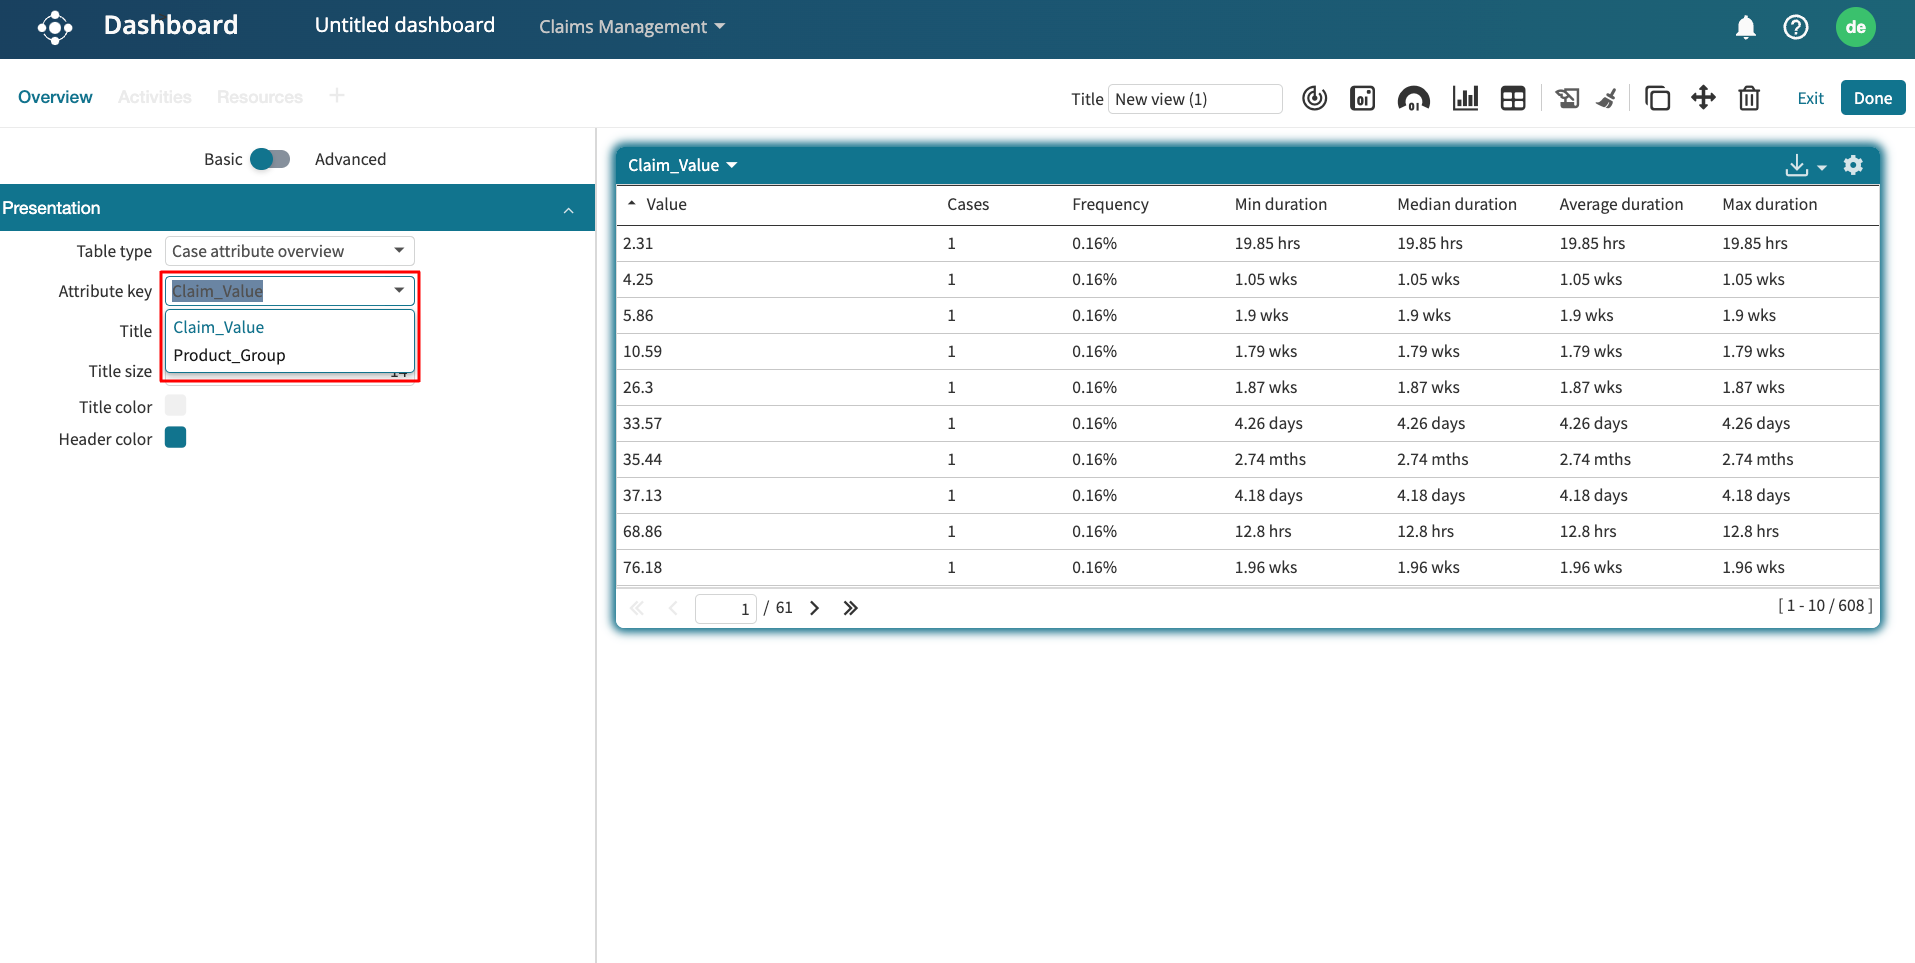
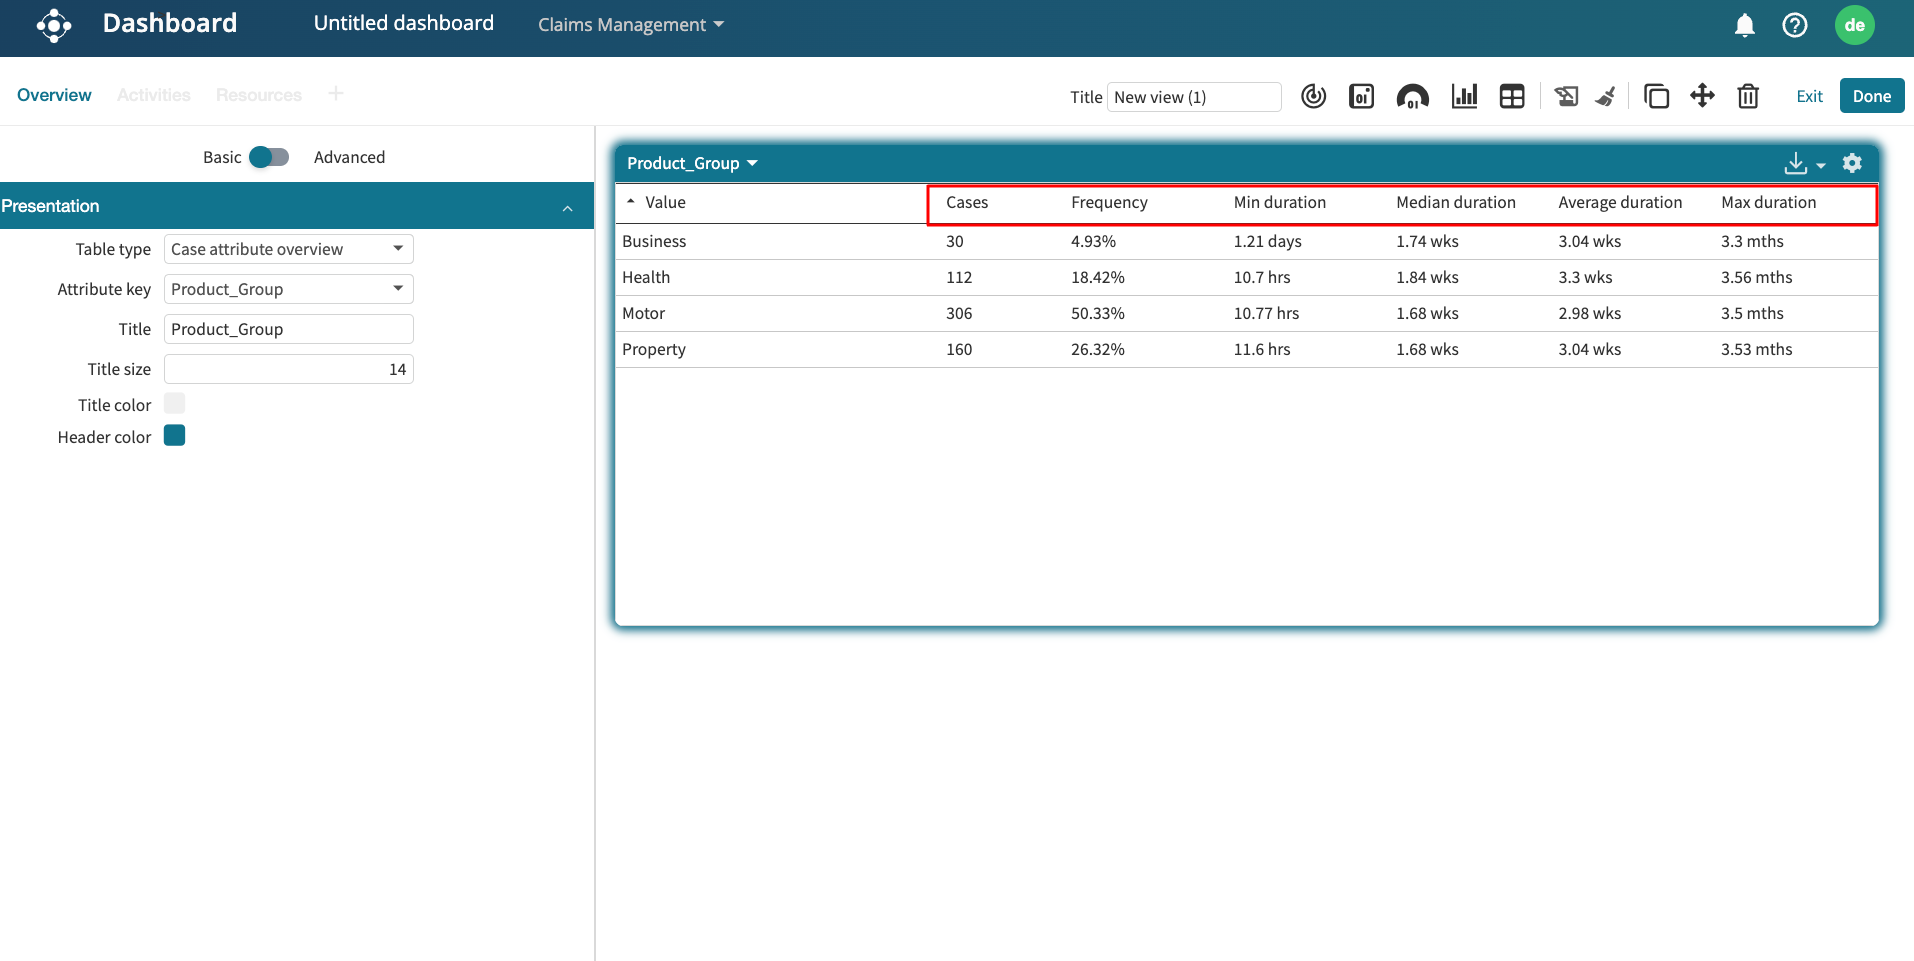
The case attribute overview table displays the aggregate statistics of case attributes in the event log. For instance, cases in an event log may have a “Product Group” attribute with values “Business”, “Health,” “Motor”, and “Property”. We can display the aggregate statistics for each of these channels.
To display the case attribute overview table, click Case attribute overview from the Table type dropdown.
Since an event log can contain multiple case attributes, we can specify which attribute statistics would be displayed in the table. To do this, click the Attribute key dropdown and choose the attribute whose values we wish to display.
The case attribute overview table contains the following statistics:
Value: The values of the specified case attribute. For example, a “Predicted” attribute can have values “Yes” and “No”.
Cases: The number of cases with the attribute.
Frequency: The percentage of cases with the attribute.
Min duration: The shortest duration among cases with the attribute.
Average duration: The mean duration of the cases with the attribute.
Max duration: The shortest duration among cases with the attribute.
Event attribute overview table
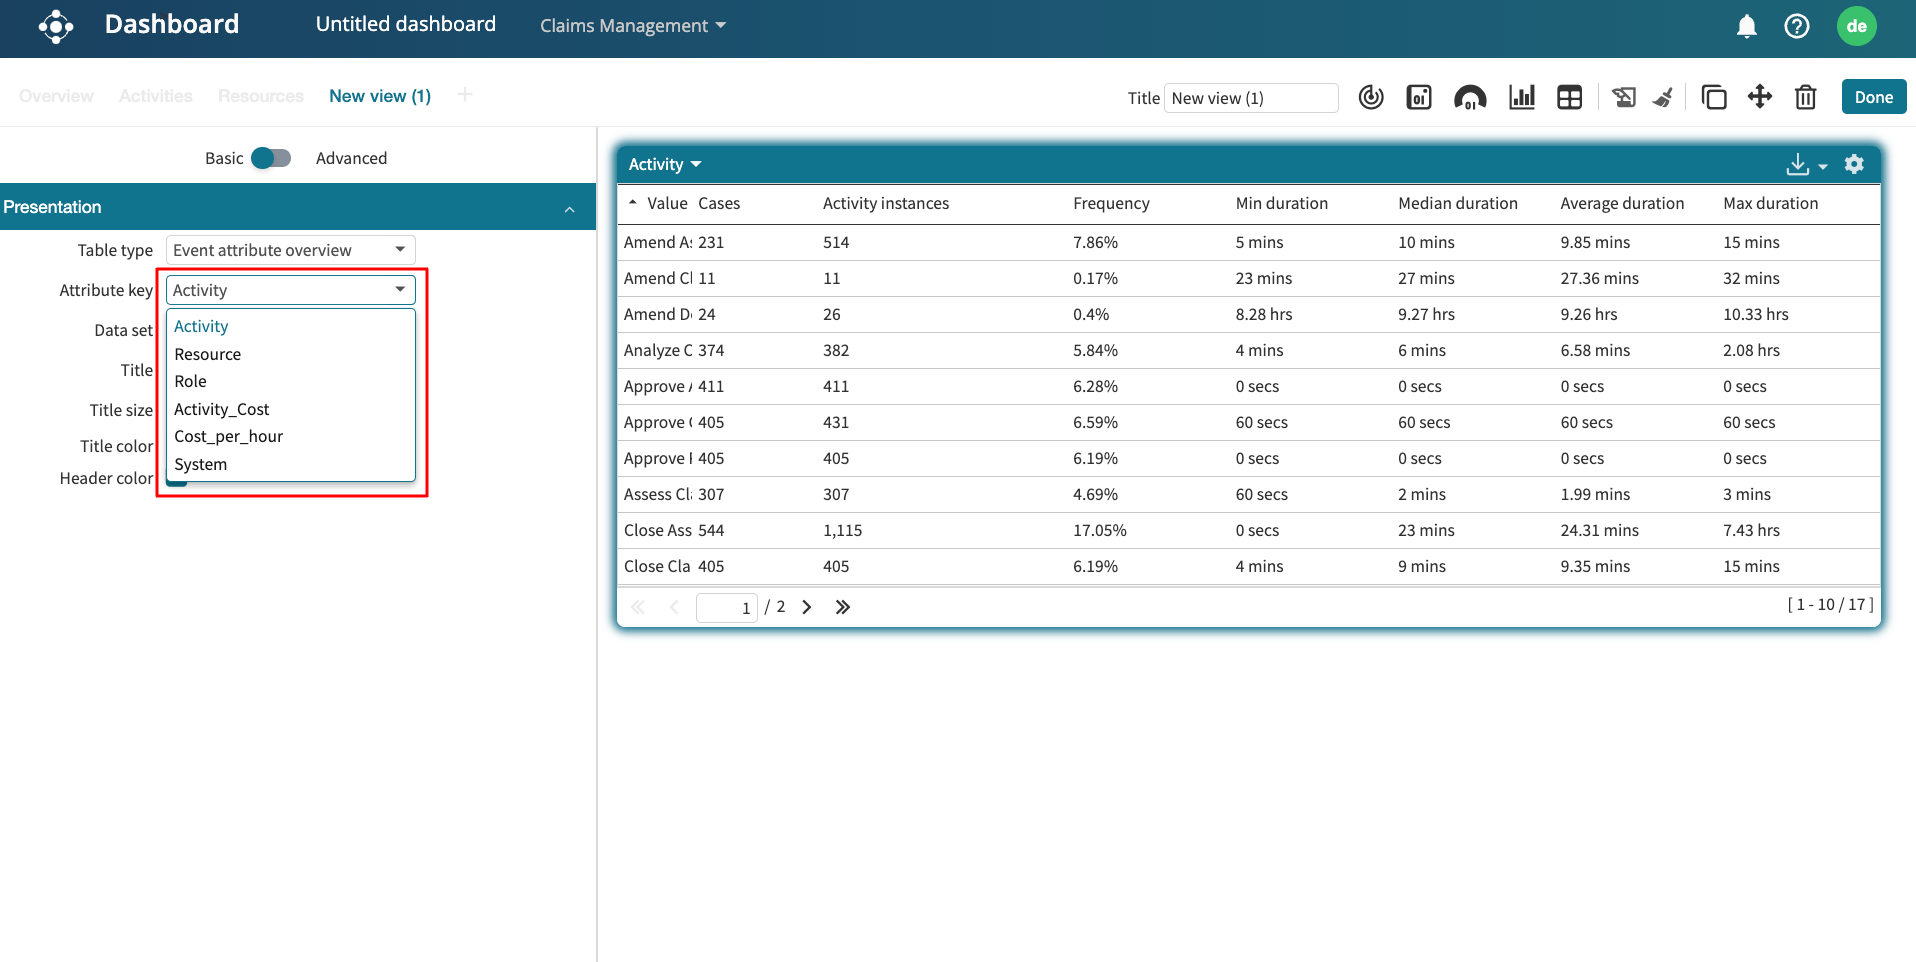
The event attribute overview table displays the aggregate statistics for the event attributes in the event log. Examples of an event attribute are activities, roles, resources, etc. To display the event attribute overview table, choose Event attribute overview in the table type dropdown.
We can specify which attribute statistics will be displayed. To do this, click the Attribute key dropdown and choose the attribute.
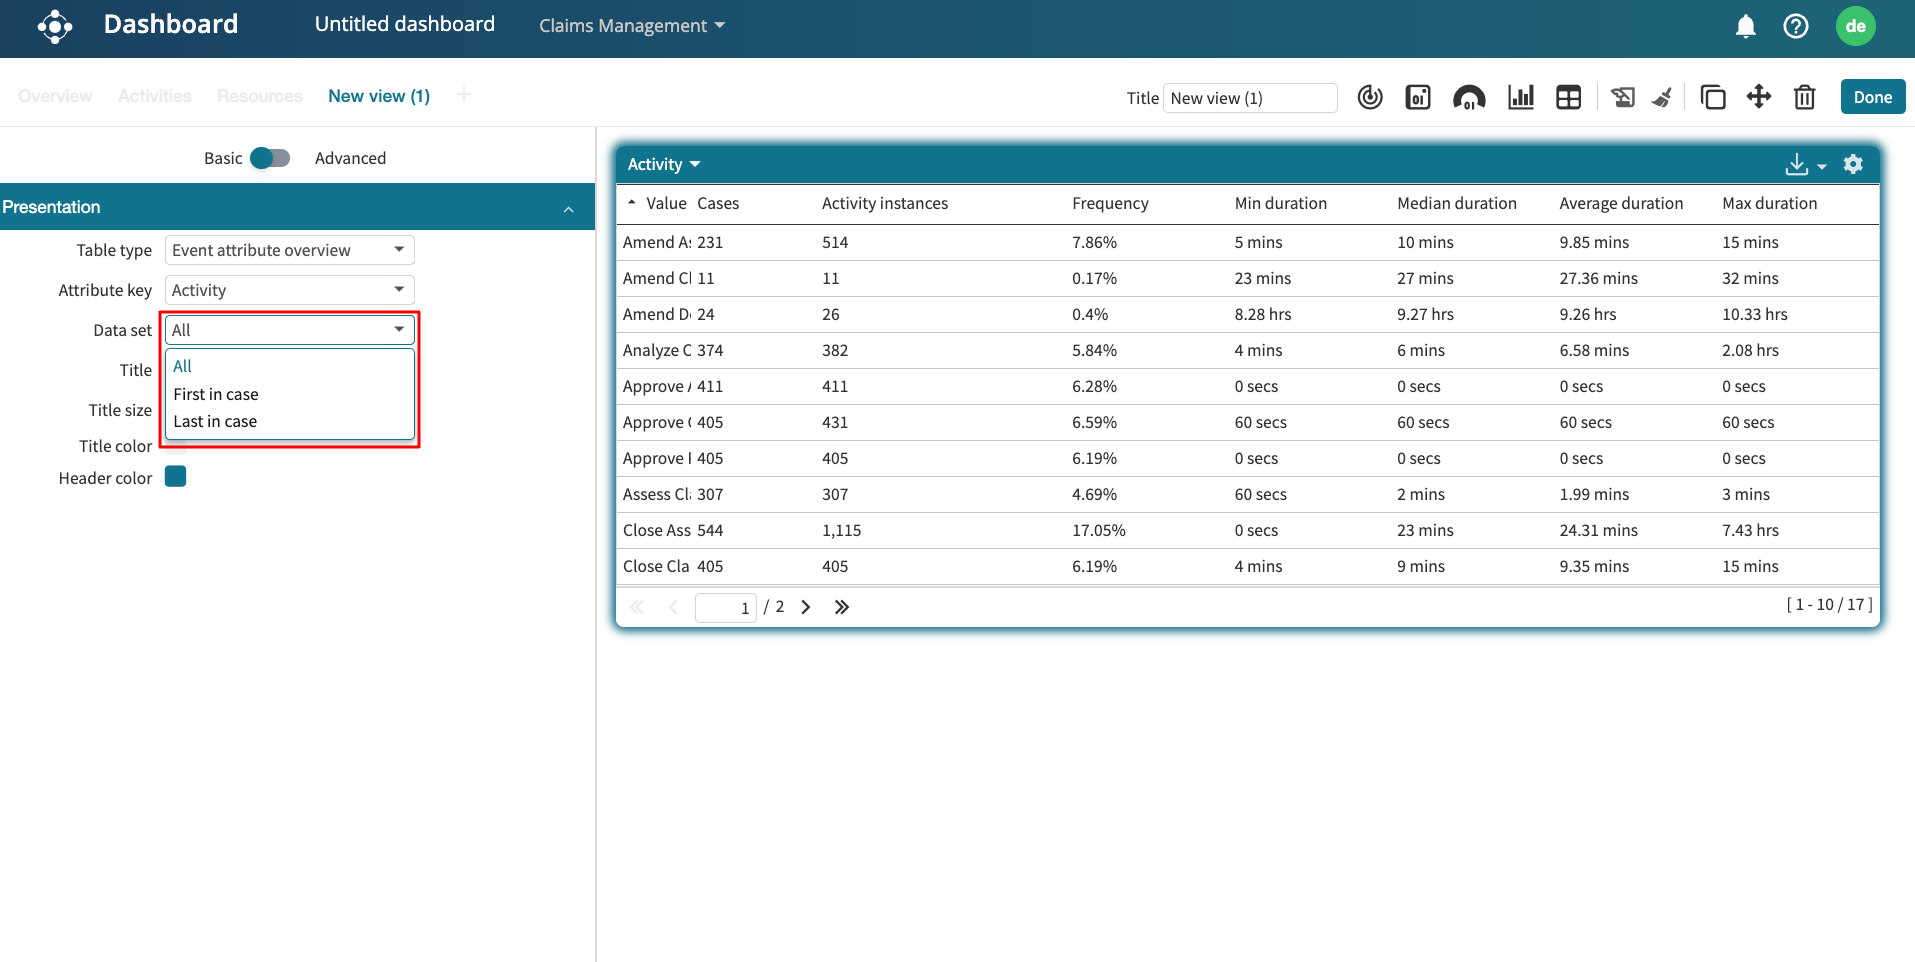
We can also specify the dataset that would be used for computing the statistics. Click the Data set dropdown. There are three dataset selection types.
All: The computation is done from the entire event log. This is the default.
First in case: The computation is done from only the first activity of all cases in the event log.
Last in case: The computation is done from the only last activity of all cases in the event log.
First touch (FT) statistics table
In a customer-facing process, some of the activities correspond to customer touchpoints. These touchpoint activities affect the customer experience, as well as several business process metrics, such as the case duration.
When optimizing a customer-facing process, it is often useful to analyze the performance of the resources that perform the first touchpoint activity in each case (the first-touch activity). For example, in a complaints handling process, it is useful to analyze the durations of cases depending on which resource performed the first-touch activity in a case (the first-touch resource). In some situations, the performance of cases depends on which resource performed the first touchpoint activity.
Apromore allows us to display several performance statistics for each first-touch resource and first-touch activity. This is achieved by adding a first-touch statistics table in a custom dashboard.
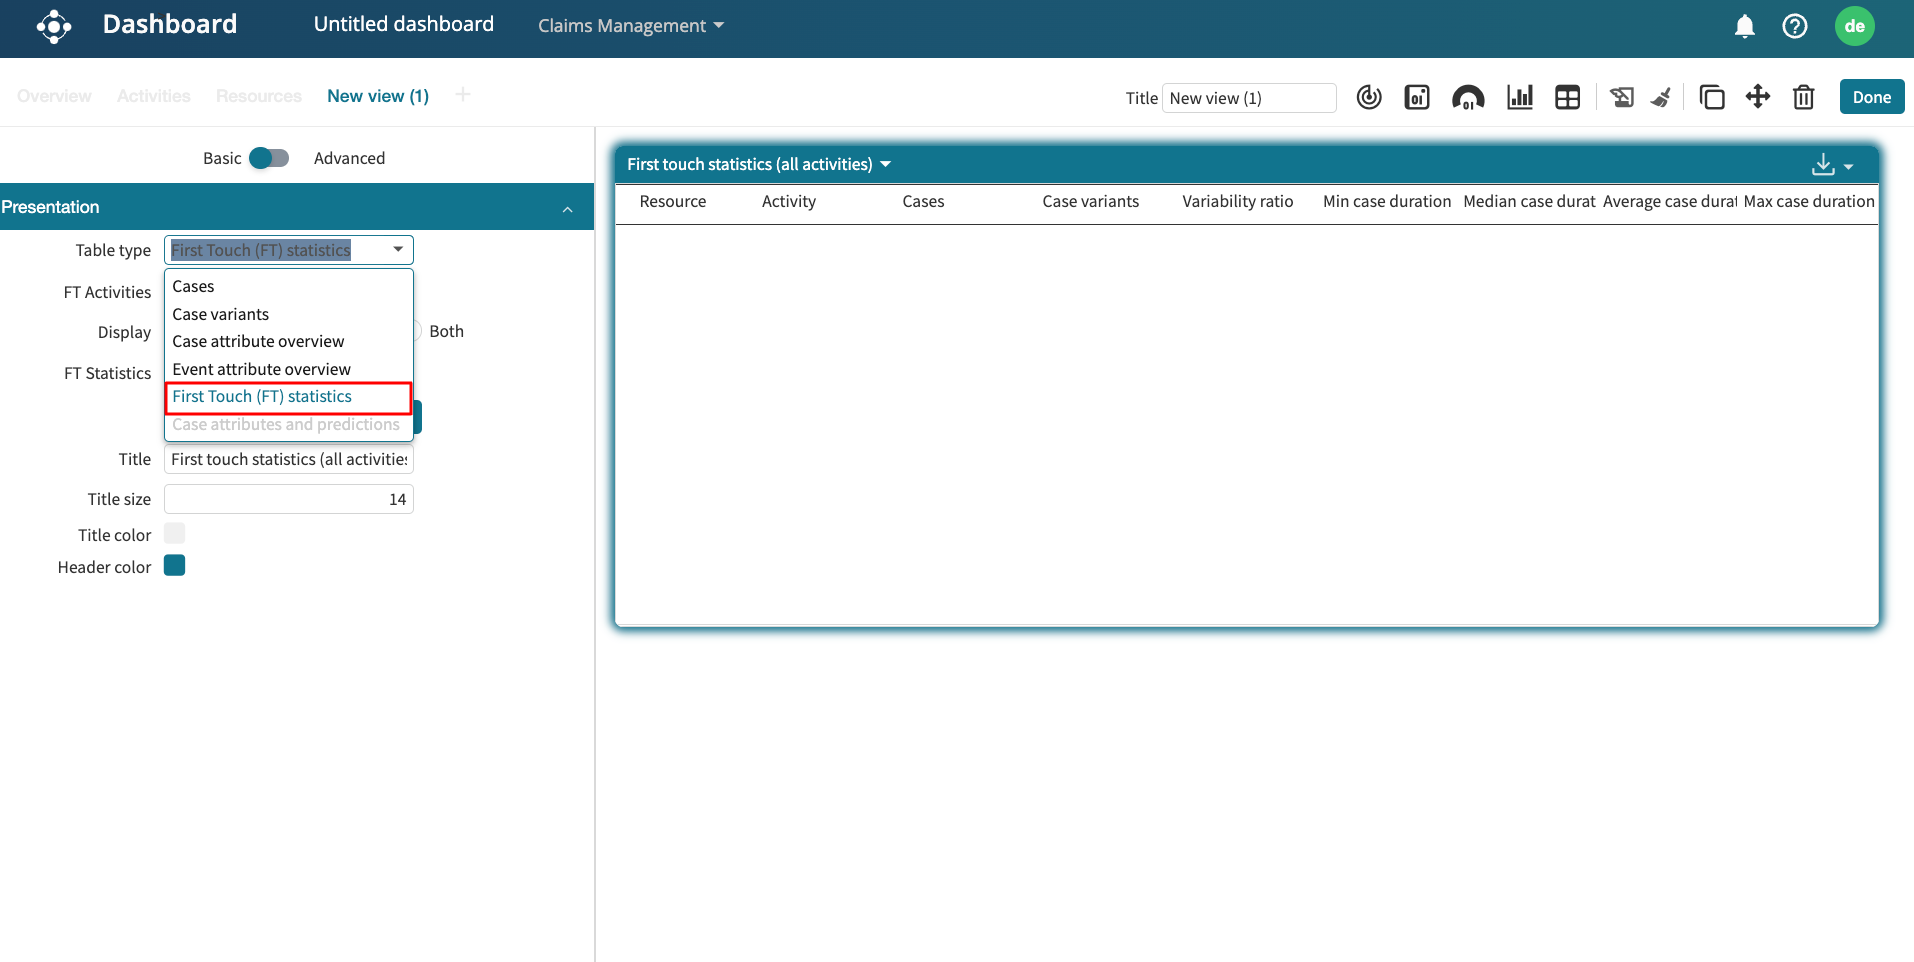
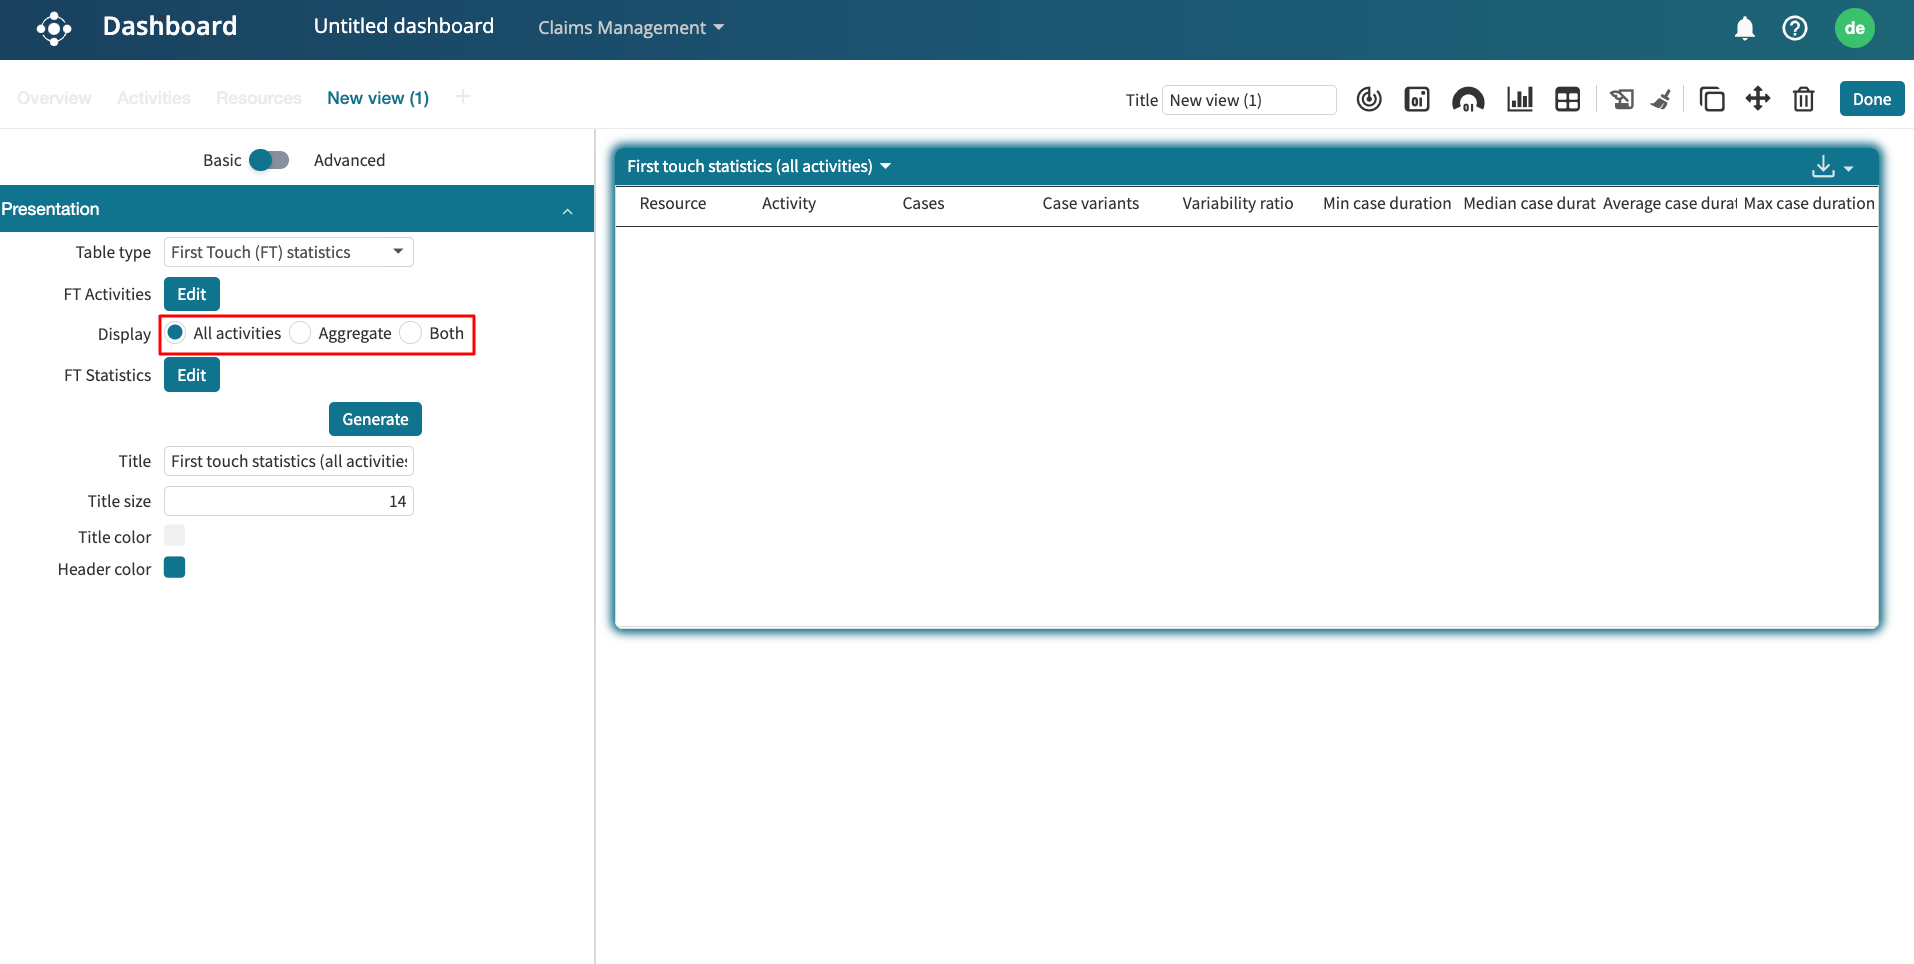
To add a first-touch statistics table, in the Table type dropdown, select First Touch (FT) statistics.
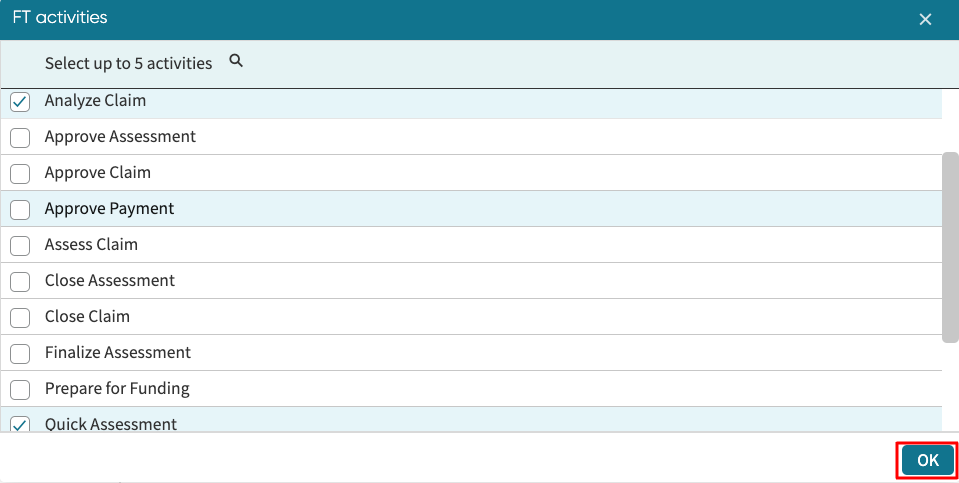
Click Edit next to FT Activities to specify the first-touch activities. We will be prompted to specify up to 5 first-touch activities. Select the activity and click OK.
Next, we select the statistics we wish to display. There are three options:
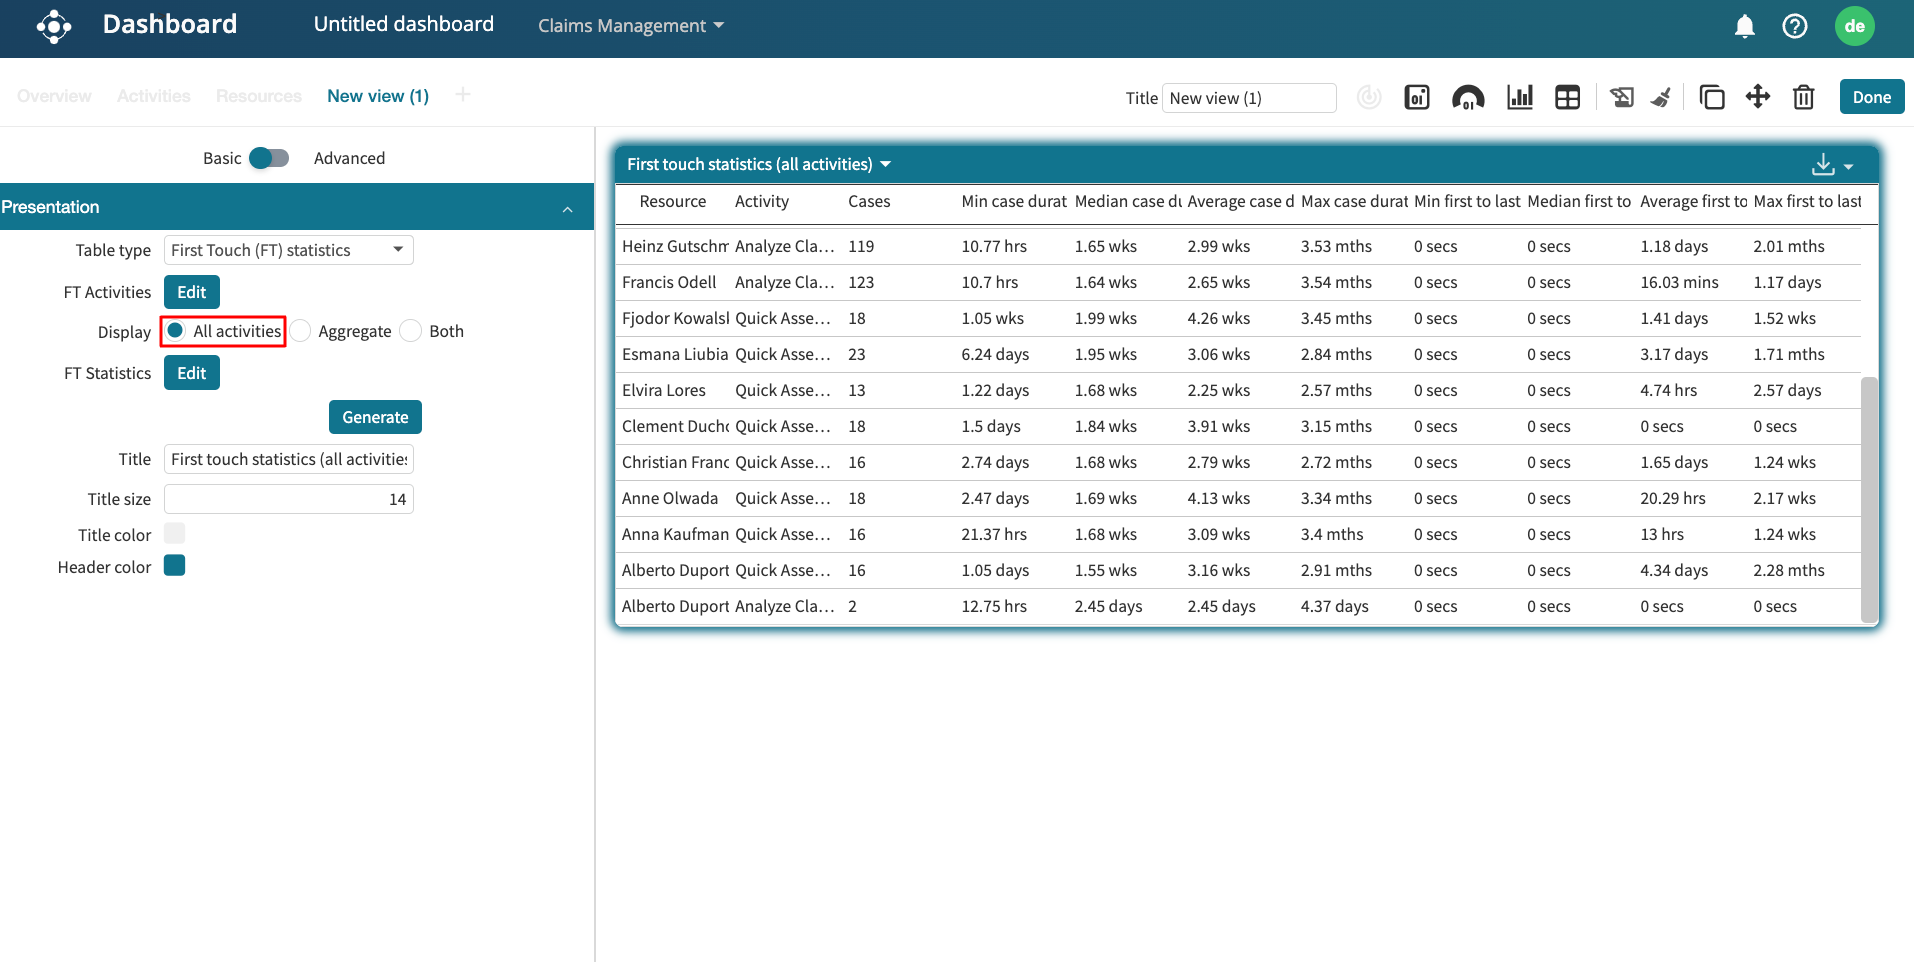
All activities: In this option, the table displays the performance statistics for each pair, which consists of a first-touch resource and a first-touch activity. If a first-touch resource performs multiple first-touch activities, the resource will appear in multiple rows.
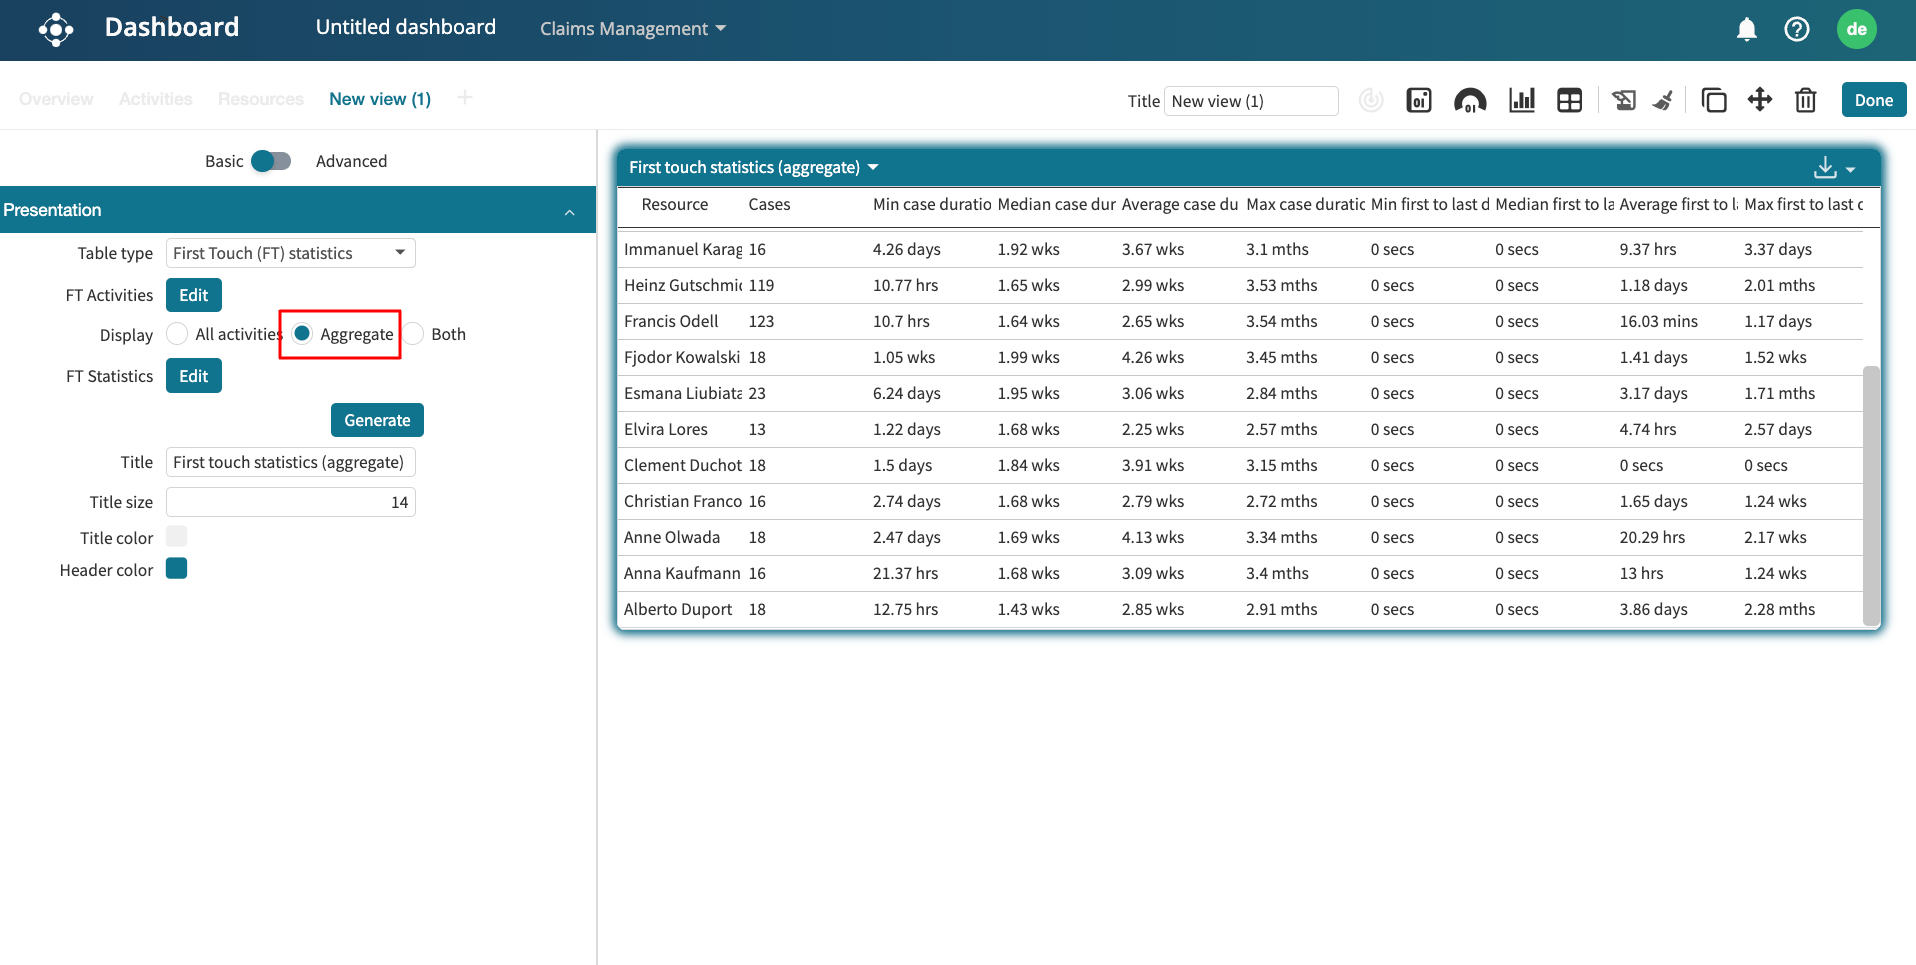
Aggregate: In this option, the table displays the performance statistics aggregated per first-touch resource. The table will contain one row per first-touch resource.
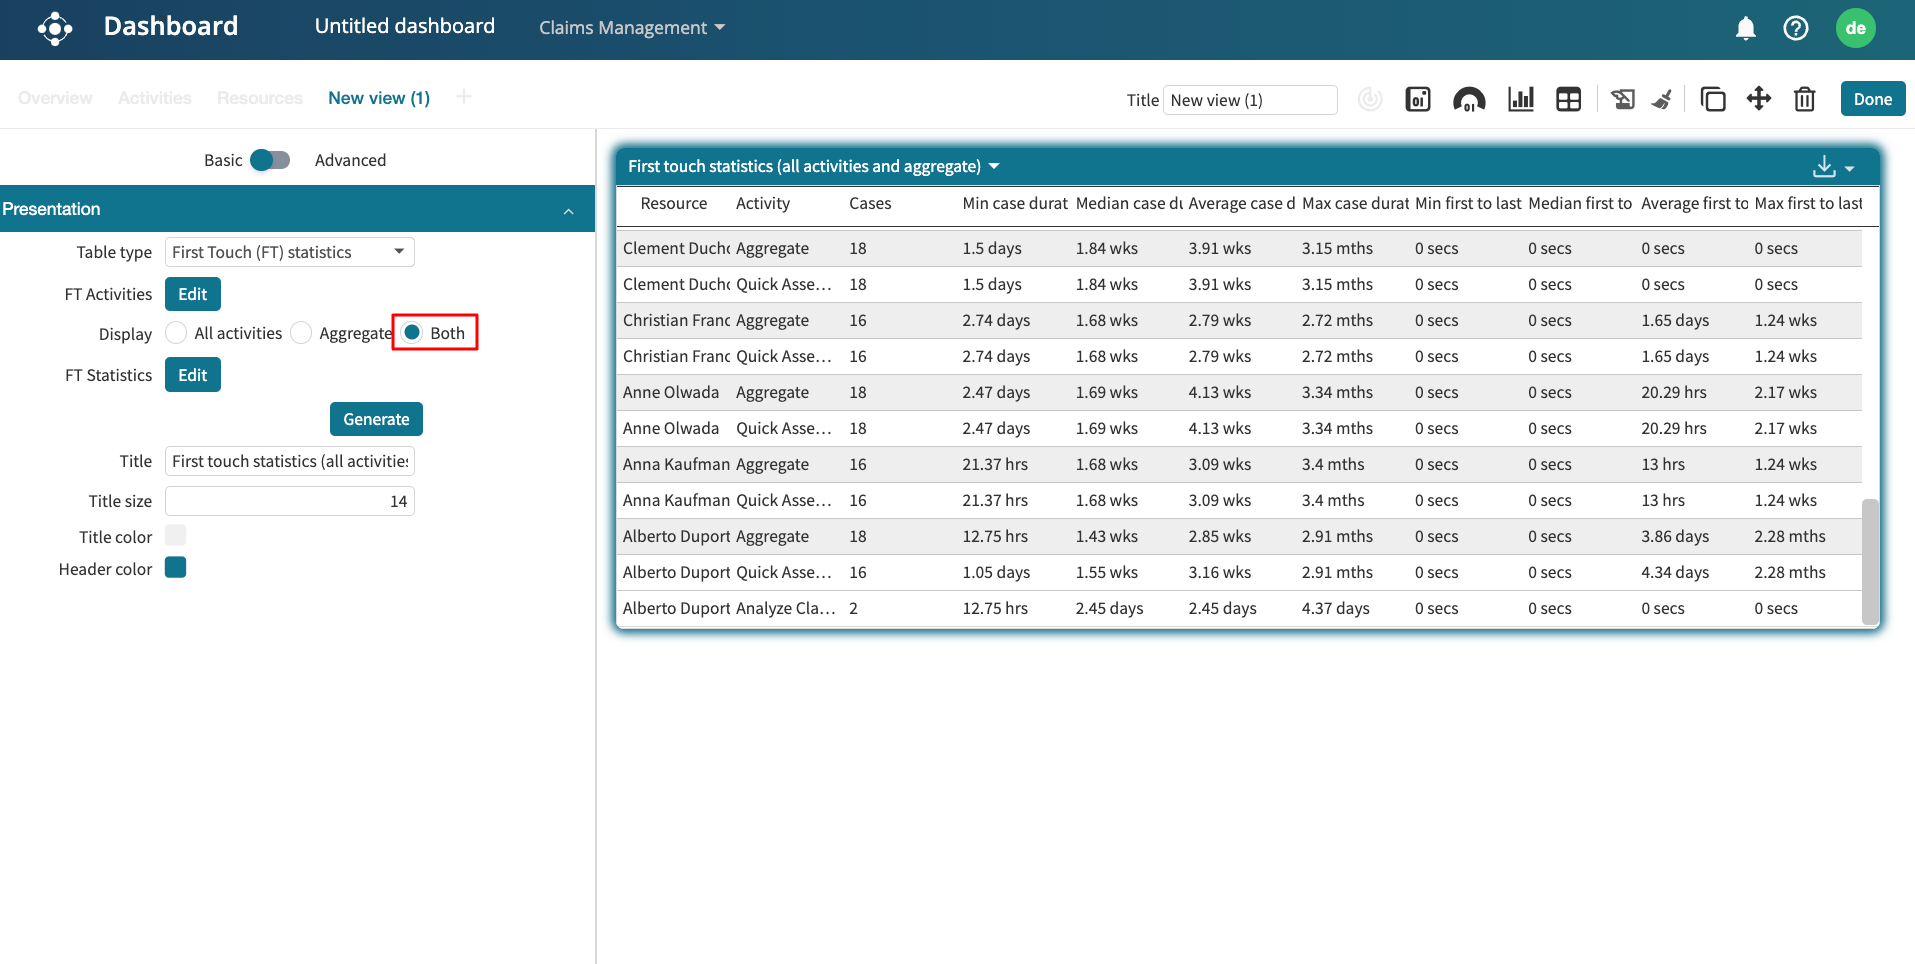
Both: In this option, the table will contain one row per pair consisting of a first-touch resource and a first-touch activity, as well as one row providing the aggregate statistics for each resource.
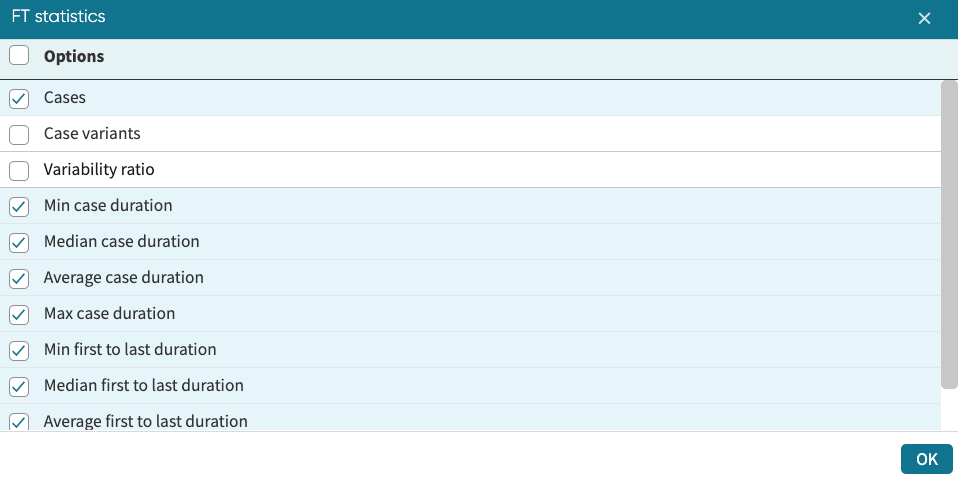
Next, we need to specify the statistics to be displayed in the table. Click Edit next to FT Statistics. We can add the following statistics:
Cases: The number of cases where the current resource was the first-touch resource (restricted to one first-touch point activity if this option is selected).
Case variants: The number of unique case variants covered by the cases in which the current resource was the first-touch resource.
Variability ratio: The ratio of the case variants to the number of cases.
Min/Max/Median/Average case duration: The minimum/maximum/median/average duration of the cases where the current resource was the first-touch resource.
Min/Max/Median/Average first-to-last duration: The minimum/maximum/median/average time between the point in a case when the current resource performed the first-touch activity to the point when this same resource performed its last activity in the case.
Click OK to add the selected statistics to the table.
We can also specify the table title, title size, and other presentation parameters.
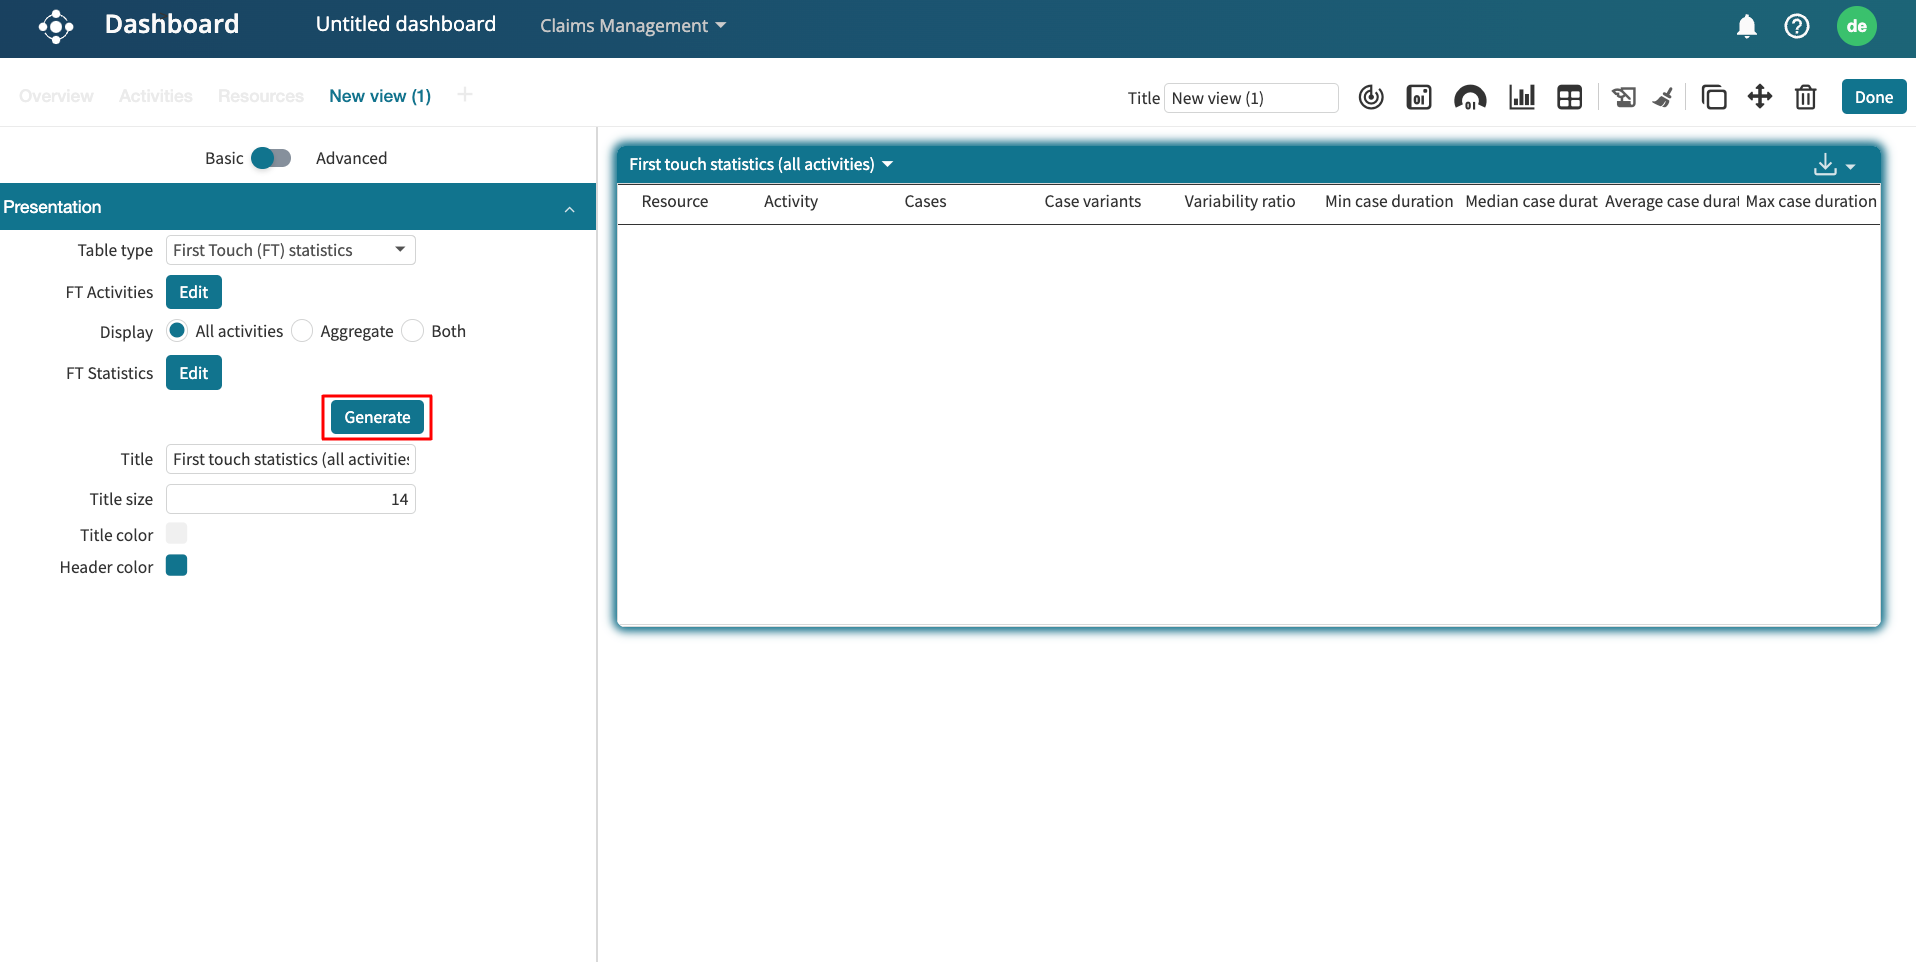
After specifying all the parameters, click Generate to generate the first-touch statistics table.
The screenshot below shows the result when we select the All activities display option and click Generate. The resource “Alberto Duport” appears twice because he was involved in both first-touch activities: Quick Assessment (16) and Analyze Claims (2).
The screenshot below shows the result when we select the Aggregate display option. “Alberto Duport” appears once, even though he was involved in two first-touch activities. The cases for both activities are aggregated, so the number of cases becomes 18.
The screenshot below shows the result when we select the Both display option. “Alberto Duport” appears three times (the first two for All activities and the third for Aggregate).
Case attributes and predictions table
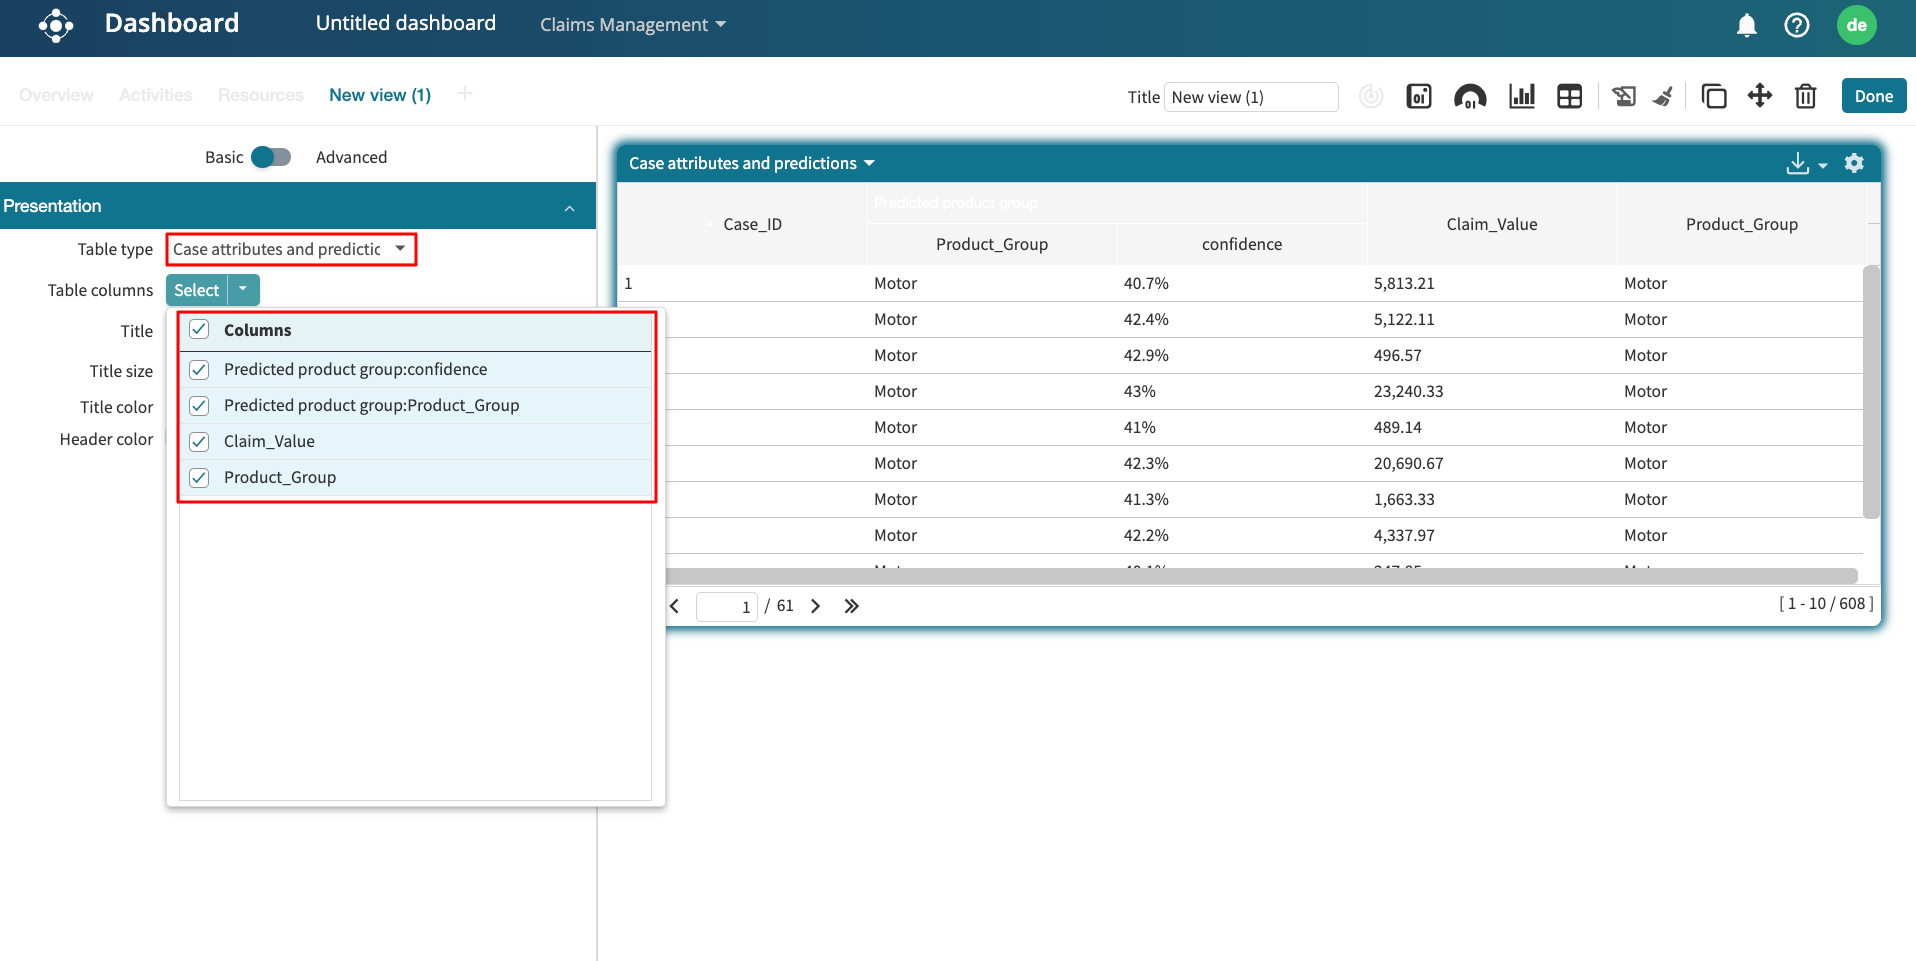
The case attributes, and predictions table displays the predicted attribute and other case attributes for every case in the event log in tabular form.
We can specify one or more case attributes that would be displayed in the table. To do this, click Select to display the Table columns dropdown. Select the attributes to appear in the table as columns.
The table displays only case attributes that have been selected.
Note
The case attributes and predictions table is only applicable for an event log that has an associated predictor.
